
Plugins 〉Histogram


Histogram

Histogram Panel Plugin for Grafana
This plugin show the Histogram of time series data.
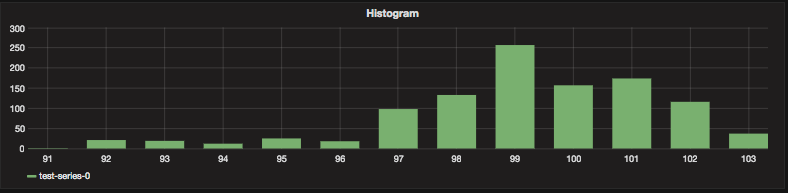
How this plugin works
This plugin receives raw time series data, and count each value occurrence, and then show the occurrence as histogram.
Supported Datasources
I confirmed this plugin work with following datasource.
- Prometheus
But, this plugin can handle time series data (defined by Grafana plugin interface).
Should work with Graphite / InfluxDB / OpenTSDB.
Options
- Bucket Size
- Can configure bucket size to make histogram data.
Known Issues
- This plugin doesn't support Elasticsearch aggregation.
- As noted above, this plugin make histogram data in plugin.
- Can't handle the Elasticsearch aggregation result yet.
Changelog
v0.1.6
- Support Grafana 4.0
v0.1.5
- Refactoring
v0.1.4
- Add template variable support
- Add bucket mode
- Fix sorting of buckets
- Fix tooltip display
v0.1.3
- Fix avg legend
v0.1.2
- Add min/max option
v0.1.1
- Update document
Grafana Cloud Free
- Free tier: Limited to 3 users
- Paid plans: $55 / user / month above included usage
- Access to all Enterprise Plugins
- Fully managed service (not available to self-manage)
Self-hosted Grafana Enterprise
- Access to all Enterprise plugins
- All Grafana Enterprise features
- Self-manage on your own infrastructure
Installing Histogram on Grafana Cloud:
Installing plugins on a Grafana Cloud instance is a one-click install; same with updates. Cool, right?
Note that it could take up to 1 minute to see the plugin show up in your Grafana.
Warning
Plugin installation from this page will be removed in February 2026. Use the Plugin Catalog in your Grafana instance instead. Refer to Install a plugin in the Grafana documentation for more information.
Installing plugins on a Grafana Cloud instance is a one-click install; same with updates. Cool, right?
Note that it could take up to 1 minute to see the plugin show up in your Grafana.
Installing plugins on a Grafana Cloud instance is a one-click install; same with updates. Cool, right?
Note that it could take up to 1 minute to see the plugin show up in your Grafana.
Warning
Plugin installation from this page will be removed in February 2026. Use the Plugin Catalog in your Grafana instance instead. Refer to Install a plugin in the Grafana documentation for more information.
Installing plugins on a Grafana Cloud instance is a one-click install; same with updates. Cool, right?
Note that it could take up to 1 minute to see the plugin show up in your Grafana.
For more information, visit the docs on plugin installation.
Installing on a local Grafana:
For local instances, plugins are installed and updated via a simple CLI command. Plugins are not updated automatically, however you will be notified when updates are available right within your Grafana.
1. Install the Panel
Use the grafana-cli tool to install Histogram from the commandline:
grafana-cli plugins install The plugin will be installed into your grafana plugins directory; the default is /var/lib/grafana/plugins. More information on the cli tool.
Alternatively, you can manually download the .zip file for your architecture below and unpack it into your grafana plugins directory.
Alternatively, you can manually download the .zip file and unpack it into your grafana plugins directory.
2. Add the Panel to a Dashboard
Installed panels are available immediately in the Dashboards section in your Grafana main menu, and can be added like any other core panel in Grafana.
To see a list of installed panels, click the Plugins item in the main menu. Both core panels and installed panels will appear.