Plugins 〉Synthetic Monitoring


Synthetic Monitoring
Synthetic monitoring application
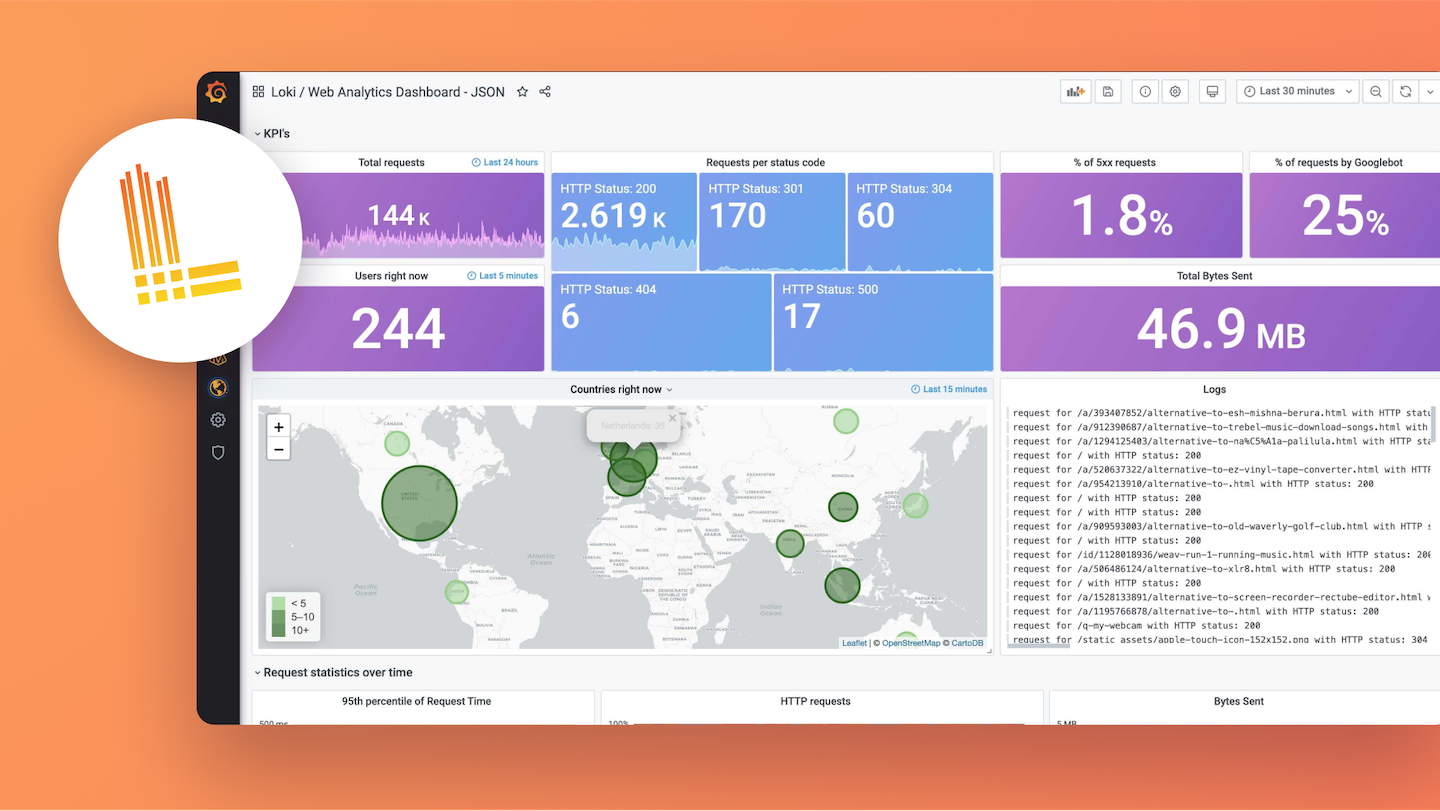
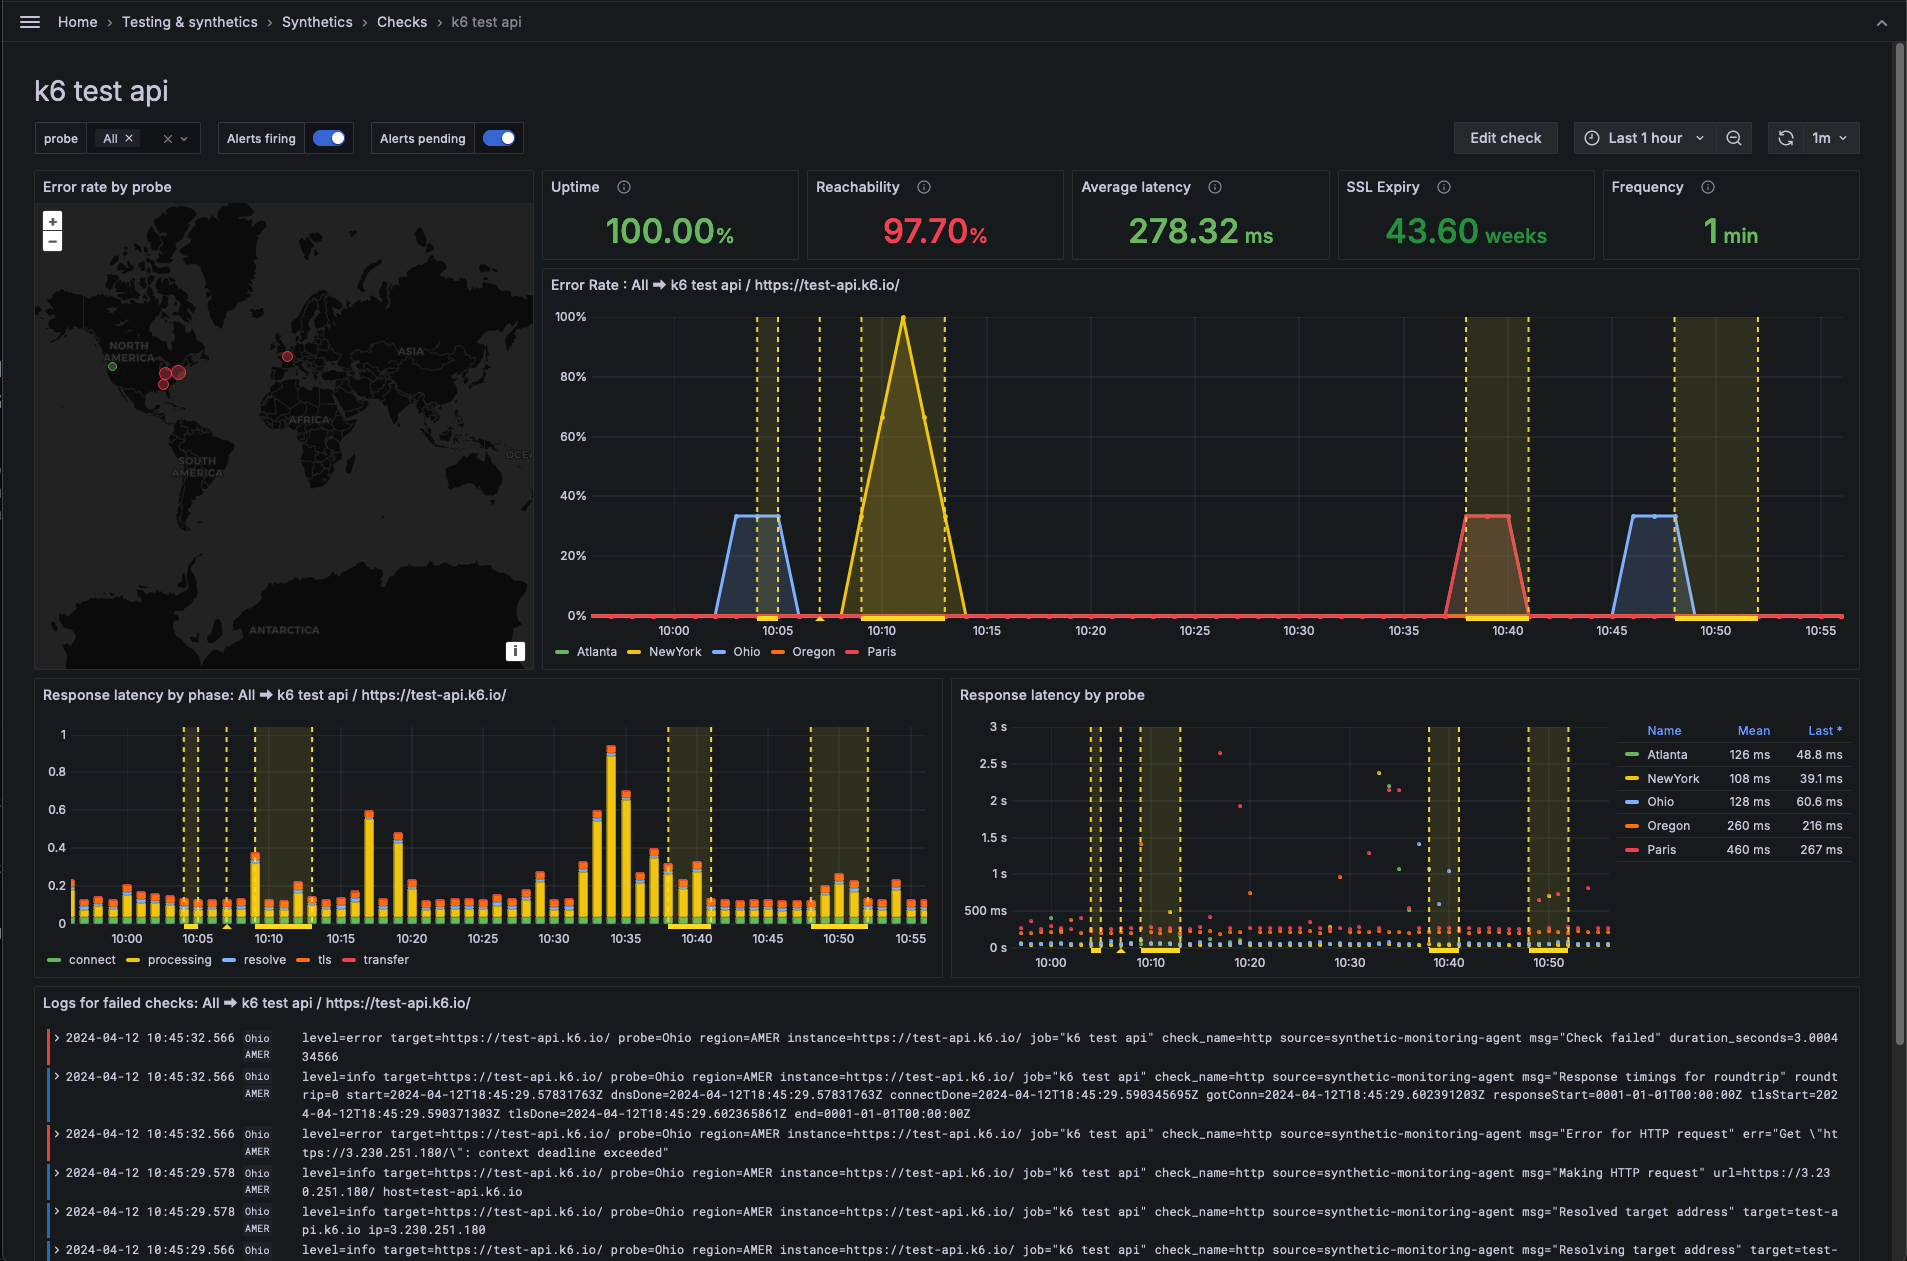
Synthetic Monitoring is a blackbox monitoring solution provided as part of Grafana Cloud. Synthetic Monitoring provides users with insights into how their applications and services are behaving from an external point of view. Users can define checks to continually test remote targets from 1 or more probe locations around the world to assess the availability, performance and correctness of the services. As each check runs, metrics and logs are collected and published to the user's Grafana Cloud service. Metrics are published to Grafana Cloud Prometheus and logs are published to Grafana Cloud Loki.
Synthetic monitoring is the successor to the original worldping application. The refreshed Synthetic Monitoring product focuses on reducing complexity and taking advantage of Grafana Cloud capabilities.
Check Types
Users can define HTTP/HTTPS, DNS, TCP and ICMP Ping checks to monitor their remote targets. Internally, the Synthetic Monitoring solution uses the Prometheus Blackbox exporter for executing the checks and collecting metrics and logs. When creating a check, users are able to customize the settings and validation rules supported by the Blackbox exporter.
Probe Locations
For each check, users can select 1 or more 'public' probe locations distributed throughout the world to run tests from. Additionally, users can run their own 'private' probe locations by downloading and deploying the Synthetic Monitoring Agent.
Configuration
Refer to the CONTRIBUTING.md guide for instructions on how to set up the Synthetic Monitoring app and run it locally.
Grafana Cloud Free
- Free tier: Limited to 3 users
- Paid plans: $55 / user / month above included usage
- Access to all Enterprise Plugins
- Fully managed service (not available to self-manage)
Self-hosted Grafana Enterprise
- Access to all Enterprise plugins
- All Grafana Enterprise features
- Self-manage on your own infrastructure
Install on Grafana Cloud
Plugins can be installed directly from within your Grafana instance or automated using the Cloud API or Terraform.
Learn more about plugin installationMarketplace plugins
This is a paid plugin developed by a marketplace partner. To purchase an entitlement, sign in first, then fill out the contact form.
Get this plugin
This is a paid for plugin developed by a marketplace partner. To purchase entitlement please fill out the contact us form.
What to expect:
- Grafana Labs will reach out to discuss your needs
- Payment will be taken by Grafana Labs
- Once purchased the plugin will be available for you to install (cloud) or a signed version will be provided (on-premise)
Thank you! We will be in touch.
For more information, visit the docs on plugin installation.
Installing on a local Grafana:
For local instances, plugins are installed and updated via a simple CLI command. Plugins are not updated automatically, however you will be notified when updates are available right within your Grafana.
1. Install the Application
Use the grafana-cli tool to install Synthetic Monitoring from the commandline:
grafana-cli plugins install The plugin will be installed into your grafana plugins directory; the default is /var/lib/grafana/plugins. More information on the cli tool.
Alternatively, you can manually download the .zip file for your architecture below and unpack it into your grafana plugins directory.
Alternatively, you can manually download the .zip file and unpack it into your grafana plugins directory.
2. Enable it
Next, log into your Grafana instance. Navigate to the Plugins section, found in your Grafana main menu.
Click the Apps tabs in the Plugins section and select the newly installed app.
To enable the app, click the Config tab. Follow the instructions provided with the application and click Enable. The app and any new UI pages are now accessible from within the main menu, as designed by the app creator.
If dashboards have been included with the application, they will attempt to be automatically installed. To view the dashboards, re-import or delete individual dashboards, click the Dashboards tab within the app page.
Changelog
1.54.0 (2026-06-29)
Features
- auto-enable Synthetic Monitoring on check-creation deep-links (#1732) (2dd296a)
- bootstrap OpenFeature provider behind useFeatureFlag (#1726) (955e375)
- emit event bus event when check created (#1744) (57672c4)
Fixes
- dangerjs (#1746) (8cf019f)
- security/high/: update security undici to v7.28.0 [security] (#1735) (9057e21)
- security/low/: update security @babel/core to v7.29.6 [security] (#1729) (179922c)
1.53.2 (2026-06-24)
Fixes
1.53.1 (2026-06-24)
Fixes
- automerge deployment prs for ops and prod (#1737) (c25b51e)
- gracefully degrade when user lacks folder permissions (#1739) (b52034a)
1.53.0 (2026-06-17)
Features
- add check type to analytics events for check dashboards and timepoint explorer (#1721) (58bf8ca)
- add Testing & synthetics nav landing page extension (#1666) (f4f1544)
- exclude execution_id in timepoint explorer (#1720) (4a6c0c4)
Fixes
- address folder view UI feedback (#1731) (4a9ce8c)
- allow check deletion with folder Edit permission (#1718) (c37bc41)
- detect logs retention period from Loki instead of hardcoding it (#1724) (b1e36af)
- handle spread operator in browser script options validation (#1722) (ddf6ef6)
- security/high/: update dependency react-router to v7.15.0 [security] (#1716) (bb3da0e)
- security/low/: update security react-router to v7.15.1 [security] (#1727) (5223955)
- use prerelease-inclusive semver range for grafanaDependency (#1723) (7e5b6bc)
Miscellaneous Chores
1.52.1 (2026-06-01)
Fixes
1.52.0 (2026-06-01)
Features
- add tracking for script examples and screenshots interactions (#1706) (2c13908)
- delete folder when all checks in folder are deleted (#1692) (c18c5a8)
- show empty folders in check list folder view (#1711) (7ec42ea)
- update k6 channel deprecation UX for v2 launch (#1682) (4e620ab)
Fixes
- add link to docs for v1 migration (#1696) (eb07883)
- add plugin-version-suffix to dev deployments (#1707) (c6d8b2d)
- allow Grafana-org git dependencies in Yarn hardened mode (#1710) (b6874ac)
- ci: drop leading dot from release-please manifest-file path (#1687) (bd03a65)
- ci: fix release-please permissions (#1683) (285b14a)
- ci: grant id-token: write to release-please caller job (#1685) (fa657ff)
- ci: grant id-token: write to renovate-reviewer workflow (#1686) (14c3fea)
- Document workflow permissions (#1705) (8250428)
- Enable dangerJS.yml (#1704) (db5cff9)
- grant cd.yml required permissions in workflow callers (#1702) (4abda2e)
- Point release please at .github/release-please/release-please-manifest.json (#1681) (cb4f307)
- prevent sensitive data leaking through Faro error reports (#1701) (432721b)
- security/low: update dependency axios to v1.16.0 [security] (#1712) (0e7752b)
- update grafana monorepo (#1708) (144edec)
- Update workflows to use more recent versions (#1689) (1e3461c)
Miscellaneous Chores
- bump @tootallnate/once from 2.0.0 to 2.0.1 (#1694) (5e17342)
- bump fast-uri from 3.1.0 to 3.1.2 (#1677) (f82dff2)
- bump protobufjs from 7.5.6 to 7.6.0 (#1684) (c2606dd)
- bump qs from 6.15.0 to 6.15.2 (#1698) (d2b58d6)
- ci: Migrate workflows to use GATB (#1680) (e094df8)
- eslint: warn on console.* in src/ production code (#1700) (8d6e6a7)
- migrate to yarn 4 with hardening settings (#1695) (854d51e)
- parseLokiLogs: replace raw data frame in error log with safe metadata (#1699) (60b8abd)
1.51.0 (2026-05-11)
Features
- add folders bulk assignment (#1657) (df8a576)
- combined folder permission model for checks (#1653) (ff8056f)
- folder assignment in check forms (#1639) (c4e1ea8)
Fixes
- prevent text overlap in check list view on narrow screens (#1644) (52e6cbe)
- update dependency ip-address to v10.1.1 [security] (#1673) (5897f0a)
Miscellaneous Chores
- bump follow-redirects from 1.15.11 to 1.16.0 (#1655) (85124d9)
- bump protobufjs from 7.5.4 to 7.5.6 (#1662) (c6bd8d2)
- bump protocol-buffers-schema from 3.6.0 to 3.6.1 (#1661) (029a0cf)
- replace inline screenshot boilerplate with sm-screenshots jslib (#1671) (7caf677)
- update dependency axios to v1.15.2 [security] (#1672) (7687f33)
- use grafana secrets api (#1665) (4af0d71)
1.50.0 (2026-04-20)
Features
Fixes
- include k6/secrets types when version management is enabled (#1664) (c11de10)
- preserve adhoc test panel state during probe refreshes (#1656) (0de4112)
- update cal response to use names attribute (#1659) (f4fdb41)
1.49.0 (2026-04-13)
Features
- add clickable trace ID linking in Timepoint Explorer (#1603) (039ad86)
- add cost attribution labels to check create/edit (#1614) (c1592c5)
- add cost attribution labels to checks list (#1620) (335fba7)
- add cost attribution labels unattributed filters (#1647) (e09a853)
- check-list: surface firing alerts first (#1630) (ae10cc6)
- cost attribution labels missing labels (#1643) (d49cde5)
- display warning when probe has unknown k6 version (#1617) (153dadc)
- improve probe status in check creation for accessibility and br… (#1619) (a257ed6)
- probes: replace reachability with execution metrics on probe cards (#1651) (c22b089)
- update byoc mapping to include prod-eu-west-7 (#1654) (03f8bf2)
Fixes
- add timeout to CDN type fetching for version management (#1636) (a599316)
- check-list: improve responsive card layout (#1628) (f819205)
- correct renovate bot actor name in CI workflow (#1634) (01a5471)
- mock service worker (#1648) (248032c)
- show inline error alert in bulk edit probes modal on failure (#1645) (26b67c0)
- update dependency lodash to v4.18.1 [security] (#1642) (0faa905)
- update dependency yaml to v2.8.3 [security] (#1633) (2aab08f)
- upgrade grafana/alerting package (#1532) (09cc026)
- use absolute positioning to fix popover inside container queries (#1635) (fe5dda2)
Miscellaneous Chores
- bump flatted from 3.3.3 to 3.4.2 (#1627) (8ecb392)
- update dependency axios to v1.15.0 [security] (#1652) (7e8236a)
- update dependency undici to v7.24.0 [security] (#1623) (3b15272)
- update README and CONTRIBUTING files with clearer instructions (#1632) (3e5d949)
1.48.1 (2026-03-11)
Fixes
Miscellaneous Chores
1.48.0 (2026-02-26)
Features
Fixes
- check test error state (#1594) (9a118c0)
- improve version management terminology and add channel navigation link (#1599) (7357225)
Miscellaneous Chores
1.47.2 (2026-02-17)
Fixes
Miscellaneous Chores
1.47.1 (2026-02-13)
Fixes
Miscellaneous Chores
- bump qs from 6.14.1 to 6.14.2 (#1591) (0ea4b9e)
- bump webpack from 5.102.1 to 5.104.1 (#1581) (68520d8)
- group @grafana/scenes packages in renovate config (#1578) (dfbf3f0)
- migrate to React Router v6 (#1573) (6edc28b)
- update dependency axios to v1.13.5 [security] (#1583) (021ccfa)
1.47.0 (2026-02-09)
Features
Fixes
- add resolution for strip-ansi dep v6 (78622bb)
- add validation to reject leading/trailing whitespace in target field (#1575) (63db3ff)
- layout for smaller screens (78622bb)
- recreate yarn.lock (78622bb)
- small refactor (78622bb)
- wait for JS chunks on quickpizza login pages + use getByRole (#1580) (f80c1ed)
Miscellaneous Chores
- extend docker-compose from base and update default version (#1577) (90d343e)
- merge in main (#1555) (1e094bb)
- upgrade scenes to v6 (#1552) (78622bb)
1.46.1 (2026-02-02)
Fixes
- latency tooltip time range (#1565) (d12345a)
- normalize Loki data frames in check test button (#1566) (66af354)
Miscellaneous Chores
- auto approve ops workflow (#1564) (51a2cb7)
- cleanup enum naming convention (#1557) (c47d523)
- migrate from MultiSelect to MultiCombobox (#1554) (c5f2c4d)
- migrate from Select to Combobox (#1553) (89d55e1)
- provide React 19 support (#1551) (468fab9)
1.46.0 (2026-01-22)
Features
Fixes
- align channel data structure with backend API specification (#1543) (55a6d48)
- avoid internal id routes (#1541) (5acc82f)
- update dependency lodash to v4.17.23 [security] (#1550) (43e0c7e)
Documentation
Miscellaneous Chores
- auto approve ops and prod-canary argo workflows (#1546) (3c106a6)
- remove old check editor (#1445) (2bdfac4)
- update dependency @types/k6 to v1 (#1372) (61b2876)
1.45.0 (2026-01-20)
Features
1.44.0 (2026-01-19)
Features
- add option to show terraform imports as blocks (#1523) (b3490d7)
- track alerts per-check routing preview and external link clicks (#1536) (53c6280)
Fixes
- add runbook url support to latency alerts (#1534) (e7675b2)
- k6 channels endpoint URL and UI display (#1530) (4b159eb)
- prevent logs panel from auto scrolling to top (#1526) (a989736)
Miscellaneous Chores
- bump qs from 6.14.0 to 6.14.1 (#1527) (e91aba2)
- update dependency undici to v7.18.2 [security] (#1538) (9abda04)
1.43.2 (2026-01-08)
Fixes
1.43.1 (2025-12-17)
Fixes
1.43.0 (2025-12-12)
Features
- add tracking for secrets management events (#1491) (2ca5ccd)
- preview Terraform configuration when creating/editing a check (#1514) (127953b)
Documentation
Miscellaneous Chores
- add channel selection instrumentation (#1518) (36dd855)
- bump jws from 3.2.2 to 3.2.3 (#1513) (9bb479b)
- deps: update grafana/shared-workflows/ action to (#1500) (3e6aea3)
- remove per-check alerts and alert routing FFs (#1515) (a1d4a10)
- update grafana/plugin-ci-workflows/ action to (#1511) (19ad0cc)
1.42.0 (2025-12-02)
Features
- add k6 version information to probes (#1269) (652e09c)
- add k6 version selection to check form (Checkster version) (#1461) (910dd45)
- add tracking for feature tab changes (#1490) (271340f)
- change 'Add new check' button to 'Create new check' with plus icon (#1460) (084ec81)
- highlight docs panel (#1444) (f7fe8b7)
- Implement native scroll for Monaco script editor (#1488) (6a75fe2)
- make monaco load types dynamically (#1289) (69bacf9)
- pass eventInfo to useCUDChecks in useHandleSubmitCheckster (#1487) (161b495)
- suggestion for duplicate functionality (#1496) (f9c18cd)
Fixes
- add eslint-disable for deprecated MultiSelect component (#1510) (40e994b)
- duplicate job name can now be edited (#1499) (abf2e43)
- respect using custom datasource when configured in jsonData (#1470) (16de336)
Miscellaneous Chores
- deps: update grafana/shared-workflows/ action to (#1493) (eb8f4b5)
- remove unused merge logic for checkster (#1495) (5084b02)
- update actions/checkout action to v5.0.1 (#1498) (787c038)
- update dependency @swc/core to v1.15.3 (#1501) (cb8df42)
- update dependency @types/lodash to v4.17.21 (#1502) (ae0681d)
- update dependency @types/node to v24.10.1 (#1503) (c1f1675)
- update dependency @types/react-dom to v19.2.3 (#1504) (a944603)
- update dependency eslint-plugin-testing-library to v7.13.5 (#1505) (a10214b)
- update dependency msw to v2 (#1394) (93d464a)
- update dependency msw to v2.12.3 (#1506) (d65703c)
- update dependency zod to v4.1.13 (#1507) (51e575c)
- update grafana monorepo to v12.3.0 (#1508) (7d87366)
- update grafana/plugin-ci-workflows/ action to (#1486) (4f4732d)
- update tanstack-query monorepo (#1509) (3571f45)
1.41.0 (2025-11-25)
Features
Fixes
- remove check list scens vis view (#1482) (6f90a89)
- use AddNewCheckButton for check list empty state (#1485) (00c3201)
Miscellaneous Chores
- bump glob from 11.0.3 to 11.1.0 (#1467) (ff2551a)
- force renovate chore titles (#1483) (383de76)
- move cursor rules into correct directory (#1484) (9760a5e)
- update actions/checkout digest to 93cb6ef (#1472) (099c7b0)
- update actions/create-github-app-token digest to 7e473ef (#1474) (6d79a9e)
- update grafana/plugin-ci-workflows digest to 45b9f89 (#1473) (584f2e2)
- update grafana/plugin-ci-workflows/ action to (#1476) (6462cac)
- update grafana/shared-workflows/ action to (#1456) (8f187d7)
- update grafana/shared-workflows/ action to (#1475) (15b7340)
- update grafana/shared-workflows/ action to (#1478) (39cbf85)
- update hashicorp/setup-terraform digest to 712b439 (#1477) (a197c7a)
1.40.0 (2025-11-19)
Features
Fixes
Documentation
Miscellaneous Chores
- update api mappings file (#1464) (74f78b0)
- update dependency glob to v11.1.0 [security] (#1468) (53d1ef7)
1.39.0 (2025-11-12)
Features
- add auto-labelling via github script (#1433) (53ae279)
- add bespoke documentation and tracking per check type (#1316) (02a328e)
- add enable/disable check button with live updates (#1416) (0de3800)
- add X-Client headers to datasource methods (#1419) (7212d24)
- added components to automerge minor and patch renovate PRs (#1432) (d0d6764)
- probe polling across application (#1415) (11a1217)
Fixes
- changes to notification policies routing view (#1441) (e00a6f7)
- pass in logs datasource (#1440) (5aa764b)
- show breadcrumbs for
Home(#1428) (bcfefdd) - update dependency @grafana/alerting to v12.3.0-19061782459 (#1426) (a113773)
- update dependency @grafana/alerting to v12.3.0-19117376164 (#1431) (0789a1b)
- update dependency @tanstack/react-query to v5.90.7 (#1443) (f32ae97)
- update dependency ip-address to v10.1.0 (#1450) (50f3f83)
- update dependency ol to v10.7.0 (#1451) (ecdd35e)
- update dependency react-hook-form to v7.66.0 (#1452) (2dd347d)
Miscellaneous Chores
- add packagerule for github action semantic scope suffix (#1454) (621fcbe)
- pin actions/github-script action to d7906e4 (#1442) (247c81b)
- update actions/github-script action to v8 (#1453) (b0d0aec)
- update dependency @swc/core to v1.15.1 (#1446) (a1ae63a)
- update dependency @types/node to v24.10.0 (#1447) (6107bb1)
- update dependency axios to v1.13.2 (#1439) (1e141e4)
- update dependency eslint to v9.39.1 (#1449) (0107aa4)
- update grafana/plugin-ci-workflows digest to 0662937 (#1435) (c073342)
- update grafana/shared-workflows/ action to (#1430) (779b9bd)
- update grafana/shared-workflows/ action to (#1436) (150d348)
- update grafana/shared-workflows/ action to (#1438) (d6a9cff)
- update grafana/shared-workflows/ action to (#1448) (3f0cc51)
- update typescript-eslint monorepo to v8.46.3 (#1425) (b73f290)
1.38.1 (2025-11-07)
Fixes
- account for logs that have no msg (#1423) (0117843)
- add check timeout to adhoc check timeout (#1420) (607931d)
- add error boundary for check features (#1424) (10e5446)
- add isDirty to setValue in checkster (check Editor v2) (#1414) (2460926)
- pathfinder guides testids (#1411) (3ffea75)
- update dependency @grafana/alerting to v12.3.0-18971876900 (#1402) (460db60)
- update dependency @grafana/alerting to v12.3.0-19031551041 (#1418) (c030e39)
Miscellaneous Chores
- decrease time for running all tests (#1410) (b67001c)
- update dependency @types/node to v24.9.2 (#1401) (19fcb2c)
- update dependency eslint-plugin-jsdoc to v61.1.12 (#1422) (491b87c)
- update dependency sass to v1.93.3 (#1409) (c7a033f)
- update grafana/plugin-ci-workflows digest to 8d12510 (#1412) (6b0b297)
- update grafana/plugin-ci-workflows digest to bd860d0 (#1405) (51da0e4)
- update grafana/shared-workflows/ action to (#1406) (580489c)
- update grafana/shared-workflows/ action to (#1408) (32c421c)
- update grafana/shared-workflows/ action to (#1417) (4324c00)
- update grafana/shared-workflows/ action to (#1421) (fdc79c0)
- update hashicorp/setup-terraform digest to 4c5fdab (#1413) (9af2b5b)
- update to zod v4 (#1407) (fa31007)
1.38.0 (2025-11-03)
Features
- add time point explorer documentation to feedback widget (#1358) (720c872)
- make check editor features be configured with FeatureName (feature toggle) (#1346) (a8de7be)
- new check editor (#1280) (4e67f2b)
Fixes
- put the container-type on the actual container (#1342) (08c1001)
- update dependency @grafana/alerting to v12.3.0-18804964027 (#1332) (d660087)
- update dependency @grafana/alerting to v12.3.0-18830193653 (#1350) (8d178fc)
- update dependency @grafana/alerting to v12.3.0-18836933406 (#1355) (37a9532)
- update dependency @grafana/alerting to v12.3.0-18839373754 (#1361) (4c88e6c)
- update dependency @grafana/alerting to v12.3.0-18845633693 (#1362) (447720c)
- update dependency @grafana/alerting to v12.3.0-18850340049 (#1369) (7e2c49d)
- update dependency @grafana/alerting to v12.3.0-18869686692 (#1388) (da6bec2)
- update dependency @grafana/alerting to v12.3.0-18878644950 (#1393) (ec42b04)
- update dependency react-error-boundary to v6 (#1384) (ccdadef)
- update dependency react-hook-form to v7.65.0 (#1351) (cafd1cb)
- update tanstack-query monorepo (#1356) (26678da)
Miscellaneous Chores
- add canvas mock to feature complete renovate list (#1386) (6b4e777)
- add packages to ignore or have a long shelf life (#1323) (c75f6e0)
- add whatwg-fetch to feature complete renovate list (#1400) (98a14ff)
- add whatwg-fetch to silence test warnings (#1392) (a1709d5)
- bumped dev dependencies which renovate flagged (#1324) (44f84f0)
- ignore react-router-dom packages for renovate (#1366) (4e87201)
- pin dependency @types/react-dom to 19.2.2 (#1385) (3ae1972)
- pin dependency jest-canvas-mock to 2.5.2 (#1347) (020d1b0)
- remove bail card for tests (#1345) (7769d17)
- remove deprecated dependencies (#1315) (564b5b5)
- remove secret id from SecretCard.tsx (#1344) (f321431)
- renovate deps bumps (#1390) (f5a21f4)
- update actions/checkout action to v4.3.0 (#1329) (2d1ddf2)
- update actions/checkout action to v5 (#1337) (c6f0606)
- update actions/create-github-app-token action to v2 (#1338) (1928acc)
- update actions/download-artifact action to v4.3.0 (#1330) (dd20985)
- update actions/github-script action to v8 (#1339) (f3a651d)
- update actions/setup-node action to v6 (#1340) (962d079)
- update commitlint monorepo to v20 (#1357) (e76823b)
- update dawidd6/action-download-artifact action to v11 (#1341) (8e12a96)
- update dependency @faker-js/faker to v10 (#1363) (8625ea8)
- update dependency @grafana/eslint-config to v9 (#1364) (76da5b3)
- update dependency @stylistic/eslint-plugin-ts to v4 (#1365) (5ccfa83)
- update dependency @swc/core to v1.13.21 (#1349) (9acc154)
- update dependency @swc/core to v1.13.21 (#1360) (9bd7a7e)
- update dependency @types/node to v24 (#1373) (5c1991e)
- update dependency axios to v1.13.0 (#1370) (db9bf32)
- update dependency axios to v1.13.1 (#1397) (811b439)
- update dependency copy-webpack-plugin to v13 (#1374) (13e3c36)
- update dependency css-loader to v7 (#1375) (60ddc00)
- update dependency danger to v13.0.5 (#1398) (f17839c)
- update dependency eslint-plugin-jsdoc to v61 (#1389) (e87d5c0)
- update dependency eslint-plugin-jsdoc to v61.1.11 (#1399) (41c2986)
- update dependency msw to v1.3.5 (#1317) (35169ca)
- update dependency prettier to v3 (#1376) (db77f66)
- update dependency sass-loader to v16 (#1377) (0aa0e30)
- update dependency style-loader to v3.3.4 (#1319) (d0ede79)
- update dependency style-loader to v4 (#1378) (086b0ed)
- update dependency ts-morph to v27 (#1379) (b144e0e)
- update dorny/paths-filter action to v2.12.0 (#1331) (3613567)
- update dorny/paths-filter action to v3 (#1380) (f689cbd)
- update github artifact actions (#1381) (3b1c58d)
- update google-github-actions/auth action to v2.1.13 (#1320) (fcc0b03)
- update google-github-actions/auth action to v3 (#1382) (525cd0d)
- update google-github-actions/setup-gcloud action to v2.2.1 (#1333) (07d47a1)
- update google-github-actions/setup-gcloud action to v3 (#1383) (86ee5b4)
- update googleapis/release-please-action action to v4.4.0 (#1334) (cc76476)
- update grafana monorepo (#1328) (bf54bf4)
- update grafana/shared-workflows/ action to (#1327) (1c5f3ae)
- update grafana/shared-workflows/ action to (#1348) (5c3f268)
- update grafana/shared-workflows/ action to (#1354) (0fc0de6)
- update grafana/shared-workflows/ action to (#1359) (3e6cd7c)
- update grafana/shared-workflows/ action to (#1387) (b1f5b37)
- update grafana/shared-workflows/get-vault-secrets action to v1.3.0 (#1335) (ba8fb4f)
- update jest monorepo to v30 (major) (#1395) (12e47d5)
- update node.js to v24 (#1396) (f14ef5d)
- update renovate fixes (#1326) (a145ba5)
- update testing-library monorepo (#1336) (76fa899)
- upgrade danger (#1368) (3bc8310)
- upgrade ol, rc-slider and react-async-hook (#1352) (17b97f3)
- upgrade prod dependencies except react-hook-form (#1325) (ed5fa12)
- upgrade react testing library (#1367) (ab5d8b9)
1.37.0 (2025-10-27)
Features
- add data-fs-element to feedback button and fix toggletip floating (#1303) (e7250bd)
- add indicator of disabled check (#1290) (1dc7f9c)
- add renovate config to ignore local dev dockerfile (#1307) (6cb988f)
- Per check alerts/notification policies (#1282) (b8447b8)
- preload app and add chunking (#1298) (ed56d85)
Fixes
- promote alerting package imports to stable (#1304) (a9e9092)
- update reachability calc for dashboards (#1285) (1743e75)
Miscellaneous Chores
- export pluginconfigpage type (#1306) (7eb2ceb)
- pin dependencies (#1291) (e9c84fb)
- update dependency @babel/core to v7.28.5 (#1309) (7d2a3cf)
- update dependency @grafana/tsconfig to v2.0.1 (#1313) (ae3d2f9)
- update dependency @swc/jest to v0.2.39 (#1310) (9e7cc4d)
- update dependency @types/node to ^20.19.21 (#1299) (68283dc)
- update dependency @types/prismjs to v1.26.5 (#1300) (3873df4)
- update dependency @types/testing-library__jest-dom to v5.14.9 (#1301) (c59e597)
- update dependency danger to v11.3.1 (#1302) (fa45d40)
- update dependency eslint-config-prettier to v10.1.8 (#1311) (cbbb731)
- update dependency eslint-webpack-plugin to v5.0.2 (#1314) (20dd42a)
- update google-github-actions/auth digest to fc21748 (#1292) (b8f85be)
- update grafana/plugin-ci-workflows digest to 80ead8d (#1293) (ec31415)
- update grafana/shared-workflows/ action to (#1294) (b642134)
- update grafana/shared-workflows/ action to (#1308) (c2a7ece)
- update grafana/shared-workflows/ action to (#1312) (7bf1c2b)
- update hashicorp/setup-terraform digest to 982f6f0 (#1295) (d742131)
1.36.1 (2025-10-15)
Miscellaneous Chores
1.36.0 (2025-10-14)
Features
- add legacy alerts restriction for new users (#1242) (69c485d)
- add Terraform HCL format (#1278) (bc0a436)
- add validation for k6 extensions and version pragmas (#1253) (ae72443)
Miscellaneous Chores
1.35.3 (2025-09-26)
Fixes
- adapt terraform config to runbook_url (#1276) (12ff3db)
- resolve incorrect alert rule group matching (#1274) (83cf287)
1.35.2 (2025-09-25)
Fixes
- change user permissions for secrets endpoints (#1267) (0be86b2)
- probe api mappings (#1270) (f5b5d48)
- upgrade Grafana dependencies to resolve API compatibility check (#1273) (9b28968)
- xaxis and check creation rounding (#1266) (7a4b9d1)
Miscellaneous Chores
1.35.1 (2025-09-05)
Fixes
1.35.0 (2025-09-03)
Features
Fixes
Miscellaneous Chores
- add gRPC dashboard and remove unused scenes components (#1249) (1d14f43)
- convert tcp dashboard to react scenes (#1241) (14ecef7)
- convert traceroute dashboard to react scenes (#1244) (3f14757)
- converted dns dashboard to react scenes (#1240) (a29f5ad)
- converted ping dashboard to react scenes (#1239) (9481b0d)
- remove rbac feature flag (#1257) (e999f92)
- remove scripted and unifiedAlerting feature flags (#1255) (a449a74)
- update editor role description in plugins.json (#1234) (d315240)
1.34.1 (2025-08-21)
Fixes
1.34.0 (2025-08-19)
Features
- apply granular secrets permissions (#1218) (579d347)
- change redirect logic for editing a check (#1203) (7f8a192)
Fixes
- always use latest terraform provider version for validation check (#1220) (bc75a19)
- explicit logs panel rendering height and width with new logs panel in core (#1230) (669753e)
- make totalChecksPerPeriod calculation equal to backend (#1221) (e45b993)
Miscellaneous Chores
- add versioning to dev deployments and update catalog (#1228) (c7af0af)
- publish dev catalog (#1224) (8585568)
- publish to ops catalog (#1225) (77e3fc1)
- update create-plugin to latest version (#1226) (8c91c83)
1.33.2 (2025-08-04)
Features
Fixes
1.33.1 (2025-07-28)
Fixes
1.33.0 (2025-07-24)
Features
Fixes
- include body and headers in HTTP check Terraform export (#1195) (1308ba7)
- prevent loading errorRateMap when data has not finished loading (#1201) (ad93b4d)
- use secret name, not UUID, to interact with the API (#1205) (1ca2704)
- validation logic for DNS targets and add appropriate tests (#1193) (2bf2f93)
1.32.0 (2025-07-15)
Features
Fixes
- add information about legacy vs per-check alerts in Alerting page (#1176) (ed8713a)
- add link to notification policies (#1179) (21369e8)
- change autoMerge to choice rather than string (#1191) (6c1befb)
- lint warnings (#1190) (b32dd09)
- publish to gcom on release (#1192) (2df299c)
- restrict environment variable (#1185) (bb1ff43)
- updated gh action names (#1183) (81e90ba)
1.31.0 (2025-07-10)
Features
Fixes
1.30.1 (2025-06-25)
Fixes
- add catch blocks to script examples (#1154) (11818a3)
- change CODEOWNERS to match actual files (#1168) (d8548d7)
- change reachability description for probes view (#1161) (915983a)
- typo in DNS form mentioning ICMP (#1167) (0224f03)
1.30.0 (2025-06-13)
Features
1.29.0 (2025-06-09)
Features
- add indicator when there is an error with per-check alerts (#1148) (f1267e1)
- register Component into Software Catalog and set up TechDocs publishing (#1150) (b691b3f)
- show per check alerts on checks list (#1139) (8471cd2)
Fixes
Miscellaneous Chores
1.28.1 (2025-05-14)
Fixes
- add sequence number to deduplicate probes made by the fixture factory (#1143) (26d1fea)
- added correctSceneVariableInterpolation function with tests (#1142) (03bf35c)
- invert order between Alerting/Execution when AlertsPerCheck is e… (#1093) (8a39f3d)
- Resolve issues reported by zizmor (#1126) (ba910c2)
- update return type of update alerts PUT request (#1135) (60feb7d)
1.28.0 (2025-05-08)
Features
Fixes
1.27.0 (2025-04-30)
Features
Fixes
Miscellaneous Chores
1.26.0 (2025-04-22)
Features
Miscellaneous Chores
- bump prismjs from 1.29.0 to 1.30.0 (#1115) (c7233cb)
- fix release-please commit message format (#1116) (2890e7e)
- standardize enum naming to PascalCase (#1121) (e6b522e)
- upgraded eslint dependencies (#1118) (307a8f7)
1.25.0 (2025-04-11)
Features
Fixes
Miscellaneous Chores
- add cursor files to gitignore (#1108) (5ae0f1d)
- rename useQuery hook to useURLSearchParams (#1111) (68c6d4a)
- renamed all schemas to camelcase (#1106) (5b41cad)
1.24.0 (2025-04-04)
Features
Fixes
- recreate yarn.lock to upgrade dependencies (#1105) (8d6d7b8)
- remove canary config (#1101) (9dd6209)
- Terraform fixes for scripted, browser and multiHTTP checks (#1095) (84840aa)
1.23.0 (2025-03-31)
Features
Fixes
1.22.0 (2025-03-25)
Features
Fixes
- add put allowed in datasource.json (#1098) (48ac346)
- edit check button disabled issue (#1091) (c125b6c)
Miscellaneous Chores
- bump @babel/runtime from 7.24.7 to 7.26.10 (#1084) (45dd4e6)
- bump axios from 1.7.4 to 1.8.2 (#1083) (5bfd005)
- bump k6 typings to v0.57.1 (#1096) (8f82b93)
1.21.0 (2025-03-11)
Features
1.20.1 (2025-03-03)
Fixes
Miscellaneous Chores
1.20.0 (2025-02-24)
Features
Fixes
- prevent adding duplicated probes when bulk editing (#1072) (efb5d42)
- terraform export fixes (#1070) (2089ded)
Miscellaneous Chores
1.19.1 (2025-02-18)
Fixes
1.19.0 (2025-02-12)
Features
Fixes
- get web vitals value for gauge component (#1059) (25dfac6)
- probe filtering behaviour and reset button (#1066) (1b7dfb4)
- pull updater image from gar instead of gcr (#1056) (654f478)
Miscellaneous Chores
- bump grafana packages to latest (#1062) (4c90797)
- fix test noise (#1057) (427e834)
- replace test services (#1060) (b26d89a)
1.18.0 (2025-02-04)
Features
Fixes
- add displayName on top of name rather than replace (#1055) (b8264af)
- fix broken checklist test (#1058) (3be444d)
- strip back ci.yml checks (#1051) (c04a797)
Miscellaneous Chores
1.17.0 (2025-01-28)
Features
- add policy bot configuration (#1047) (406851a)
- increase check timeout to scripted, browser and multihttp checks (#1049) (df9c5d9)
Fixes
- add new probes metadata (#1044) (006bc43)
- wrap labels to always display View dashboard button (#1045) (8c45572)
1.16.12 (2025-01-14)
Fixes
- change dirty strategy in check form (#1037) (25ee12f)
- filter by probe on data transferred and assertions panels for browser and scripted checks (#1030) (23cf761)
- handle deprecated probes in the UI (#1040) (c7b23ed)
- keep reference of submitting form internally (#1039) (bd91a18)
Miscellaneous Chores
1.16.11 (2024-12-19)
Fixes
1.16.10 (2024-12-17)
Features
Fixes
Miscellaneous Chores
1.16.9 (2024-11-29)
Fixes
- create and organise CheckList page folder with dependent components (#998) (f45108e)
- filter out disabled checks for execution count total (#999) (5383102)
- moved routing components to own high-level folder (#997) (02a0a95)
Miscellaneous Chores
1.16.8 (2024-11-25)
Features
Fixes
Miscellaneous Chores
react-router-dommigration (#980) (f11b89a)- deps: bump cross-spawn from 7.0.3 to 7.0.6 (#994) (61073a3)
1.16.7 (2024-11-15)
Fixes
1.16.6 (2024-11-11)
Fixes
1.16.5 (2024-10-21)
Features
Fixes
- check target tooptip (#971) (e5533fe)
- Update asc / desc reachability sorting (#970) (c281b77)
- update browser examples to use async check (#972) (c7494ca)
Miscellaneous Chores
1.16.4 (2024-10-09)
Fixes
1.16.3 (2024-10-09)
Miscellaneous Chores
1.16.2 (2024-10-08)
Miscellaneous Chores
1.16.1 (2024-10-08)
Miscellaneous Chores
1.16.0 (2024-10-07)
Features
- extra validations for browser checks (#942) (1e3960d)
- set default timeout for browser checks to 1 min (#945) (e2be2da)
Fixes
Miscellaneous Chores
- change browser checks to public preview status (#952) (26d0c5b)
- Setup release-please (#933) (e7ebcd6)
- Tune release process (#947) (1b3f2c0)
- update fillform example to use async check (#949) (91b00e5)
1.15.2 (2024-9-19)
- Allow to disable browser checks in probe creation (https://github.com/grafana/synthetic-monitoring-app/pull/928)
- Add browser checks validation (https://github.com/grafana/synthetic-monitoring-app/pull/930)
- New version of browser dashboards (https://github.com/grafana/synthetic-monitoring-app/pull/931)
- Add private preview badge to browser checks (https://github.com/grafana/synthetic-monitoring-app/pull/935)
- Updated status badge appearance and organisation (https://github.com/grafana/synthetic-monitoring-app/pull/936)
- Upgrade k6 types version to 0.53.0 (https://github.com/grafana/synthetic-monitoring-app/pull/937)
- Set browser checks min frequency to 60 seconds (https://github.com/grafana/synthetic-monitoring-app/pull/938)
- Add script examples specific to browser checks (https://github.com/grafana/synthetic-monitoring-app/pull/939)
1.15.1 (2024-8-26)
- Bump axios from 1.6.7 to 1.7.4 (https://github.com/grafana/synthetic-monitoring-app/pull/909)
- Revert the way we do datasource lookups (https://github.com/grafana/synthetic-monitoring-app/pull/911)
- Fix typo in alerts error message (https://github.com/grafana/synthetic-monitoring-app/pull/913)
- Obtain SM datasource by its type and not name to prevent errors when it’s been renamed (https://github.com/grafana/synthetic-monitoring-app/pull/921)
- Revert sm:write permissions to be obtained froom org roles instead of datasource (https://github.com/grafana/synthetic-monitoring-app/pull/923)
- Add new version of uptime calculation query and set it under FF (https://github.com/grafana/synthetic-monitoring-app/pull/840/)
- Hide grpc option in check cards when feature flag off (https://github.com/grafana/synthetic-monitoring-app/pull/922)
1.14.13 (2024-8-20)
- Added datasource RBAC support in the plugin. The plugin now respects RBAC permissions for its datasources.
- Fix a bug with saving existing checks with empty TLS configs
- Fix a regression where the http checks follow redirects checkbox was missing
- Prevent problematic characters from being added to job names (commas and single/double quotes)
- Fix a bug with the assertions graph success / failure rate making the wrong query on scripted checks dashboard
1.14.11 (2024-7-25)
- The check creation pages have been redesigned to be more user-friendly and intuitive. Every check now has five sections regardless of type.
- Check types now have a parent group: Api Endpoint, Multi step and Scripted in the plugin UI.
- Added restrictions when users have the viewer role.
1.14.10 (2024-7-10)
- Upgrade scenes to version 5.1.0
- Fix cursor type on cards without links
- Improve non-initialized pages to provide section specific content
- Enforce named exports
- Avoid horizontal scrolling on check's dashboard
- Add regression test for longitud validation fix
- Add datasource to includes in order to provide support for loading synthentic monitoring appn assets from a CDN
- Make loki query fetch range instead of instant logs to prevent timeout errors on ad-hoc tests
1.14.9 (2024-6-25)
- Fix home dashboard when applying filters for error percentage, latency and error rate panels.
- Fix validation for longitude field in custom probes creation form.
1.14.8 (2024-6-19)
- Updated Grafana dependencies (@grafana/ui, @grafana/data, @grafana/runtime and @grafana/schema) to version 11.0.0
- Updated Grafana dependency version in plugin configuration.
- Added a PasswordField component to mask password inputs in the HTTP Auth section.
- Added a link to the docs in the check’s custom labels section.
1.14.7 (2024-6-11)
- Added test execution rate in the check list page. Added accompaying sort options to sort checks by ascending / descending execution rates
- Fixed an issue where drilldowns are not working in the Scenes home dashboard
- Changed the HTTP authentication type to a radio button pattern rather than multiple checkboxes
- Changed probe form validation to zod schemas
1.14.6 (2024-6-5)
- Removed public preview message from multihttp checks
- Added url parameters to manage check list state, allowing deep linking to specific checks
- Fix an issue on the homepage summary table where jobs were being duplicated
- Fix text for SSL tooltip in Scenes dashboards
- Fix alignment issues for labels and headers in the check creation forms
- Fix terraform export for private probes
- Fix wording for test executions in executions calculator
- Changed check form validation to zod schemas
1.14.5 (2024-5-23)
- Fix a bug with with SSL failing checks option not being respected in http checks
1.14.4 (2024-5-2)
- Fix a bug with traceroute timeouts gettings the wrong default value
1.14.3 (2024-5-1)
- Fix a bug where checks with a frequency of 1 hour showing incorrect uptime on the check dashboards
- Fix a bug on the config page where the terraform export didn't have the dependencies it needed
1.14.2 (2024-4-30)
- Make the check creation form responsive
1.14.1 (2024-4-29)
- Temporarily disable responsive form layout that was causing issues with the scripted check editor
1.14.0 (2024-4-29)
- Add a k6 based scripted check type
- Updates design of the check creation form
- Update documentation links
- Only show query params for the HTTP check type
- Fix the error log toggle to query by probe success instead of log error level
1.13.4 (2024-4-18)
- Allow label limits to be configurable on a per tenant basis
- Fix a bug where check tests could timeout before their configured timeout
- Use average of http request duration for scripted check latency
1.13.3 (2024-4-11)
- Fix a bug where the min step in dashboard queries was defaulting to 5 minutes unnecessarily
1.13.2 (2024-4-10)
- Fix a bug where basic auth was always being submitted even when empty
- Fix a few typos in the scripted check form
- Clean up some old feature flags that were no longer used
1.13.1 (2024-4-2)
- Fix a bug with empty search state and bulk selection
- Fix a bug with the TCP IP version selection section of the check edit form
1.13.0 (2024-3-27)
- Lengthen frequency time range to up to 1 hour
1.12.10 (2024-3-27)
- Fix a bug where uptime and reachability were reversed in the check list
- Redirect old scenes links to the updated model
1.12.9 (2024-3-21)
- Fix a bug with bulk unselecting checks
- Fix a bug that prevented querying for long time periods
1.12.8 (2024-3-13)
- Update dashboards to indicate they are deprecated. Newer versions are available inside the app itself.
- Fix a broken link to check creation when a user has no checks
- Add script examples to scripted check UI
1.12.7 (2024-3-11)
- Update dashboards to use timeseries instead of the deprecated graph panel
- Fix a non-functional "Add check" button being visible for viewers.
- Remove deprecated arrayVector
- Add a probe region select
1.12.6 (2024-2-26)
- Add alert annotations to the dashboards
- Allow unlimited headres in HTTP checks
- Improve navigation after check creation
- Change the navigation model to use individual checks instead of dashboard dropdowns
1.12.5 (2024-1-25)
- Revamp the MultiHTTP dashboard
- Add a "Copy JSON" button to the dashboard menus so people can add charts to their own dashboards
1.12.4 (2023-11-09)
- Bump up the max data points in the checks visualization view
- Fix a bug when instances have no alert ruler datasource
1.12.3 (2023-11-07)
- Rework the summary dashboard to provide a more useful overview of checks
- Fix a bug with selecting individual URLs in the MultiHTTP scene
- Add improved description tooltips for reachability and uptime
- Improve error handling in the MultiHTTP form by scrolling to the first error and focusing inputs
- Change default MultiHTTP timeout
- Add additional context for assertion inputs
- Include MultiHTTP in generated terraform config
- Fix a bug with routing that caused flickers when the plugin had not yet been initialized
1.12.2 (2023-10-16)
- Update docs on publisherToken provisioning
- Persist check filters after they've been selected and fix some layout issues
- Fix some layout issues in MultiHTTP checks
- Add check testing to MultiHTTP checks
1.12.1 (2023-9-21)
- Fix some issues with check type selection
- Add a MultiHTTP usage calculator
1.12.0 (2023-9-20)
- Allow all users to view alerts, and editors to edit them
- Fix spacing issues in the test check modal
- Update template dashboard JSON that was causing Grafana to crash on copy
- Update MultiHTTP URL validation
- Remove some old feature flags
- Remove the deprecated check list visualization view
1.11.7 (2023-9-1)
- Add filtering and search to the check list visualization view
- Add enable/disable to the MultiHTTP form
- Fix query param fields in MultiHTTP
- Remove worldmap panel dependency
1.11.6 (2023-8-23)
- Add an explore button to visualization menus
- Encode/decode MultiHTTP request bodies in base64
1.11.5 (2023-8-14)
- Add alerting levels to MultiHTTP
- Fix error rate maps no filtering by probes
- Make the check editor back button less confusing
- Remove deprecated ArrayVector
- Fix some URL validation
- Various layout issues
1.11.4 (2023-7-19)
- Fix an unhandled error in the traceroute nodegraph panel
- Various tweaks to the MultiHTTP scene and form
1.11.3 (2023-7-10)
- Fix an incorrect frequency value in the HTTP scene
- Add an "edit check" button to all scenes
1.11.2 (2023-26-1)
- Fix broken dashboard link from summary page
- Fix repeated "dashboard" on summary page
1.11.1 (2023-26-1)
- Add a multihttp scene behind a feature flag
1.11.0 (2023-6-1)
- Include some fixes for scenes
- Fix some issues with identifying datasources when an instance is renamed
- Replace the visualization list view with a scene
- Remove legacy theming
1.10.1 (2023-4-26)
- Suppress an erroneous error toast in the alerting view
- Add some testing for Terraform generation output
1.10.0 (2023-4-21)
- Add and release multi-http functionality behind feature flag
- Add and release scenes based dashboards behind feature flag
- Fix a bug with base64 encoding in TCP query/response
- Update datasource query editor to include probes in traceroute queries
1.9.36 (2023-3-15)
- Update build tooling from grafana-toolkit to create-plugin
1.9.35 (2023-2-16)
- Fix a bug with rendering data in the node panel for traceroute checks
1.9.34 (2023-2-09)
- Fix a bug with the config page not rendering in cloud instances
1.9.33 (2023-2-07)
- Upgrade the Worldmap panel dependency
1.9.32 (2023-2-06)
- Fix a bug with the config page not rendering in cloud instances
1.9.31 (2023-1-13)
- Fix a bug where checks weren't refetched after bulk updating probes
- Add some information on how to set up a private probe after creating a token
- Show error state if validating the body of an HTTP HEAD request
- Remove the legacy initialization flow
1.9.30 (2023-1-9)
- Remove deprecated initialization flow
1.9.29 (2023-1-4)
- Add proxy headers to HTTP checks
1.9.28 (2022-11-9)
- Update Alert URL for compatiblity with Grafana 9
1.9.27 (2022-11-8)
- Fix error message on non-traceroutes timeout field
1.9.26 (2022-11-2)
- Fix a duplicate button on the setup page
1.9.25 (2022-10-24)
- Support the new Grafana navigation setup
1.9.24 (2022-10-11)
- Fix a bug with dashboard redirects that were causing them to lose query params
1.9.23 (2022-10-5)
- Bump Grafana dependencies to version 9
1.9.22 (2022-9-15)
- Update worldmap panel dependency
1.9.21 (2022-8-10)
- Update link to alerting UI
1.9.20 (2022-8-2)
- Make sure 100% is never rendered as 100.0%
1.9.19 (2022-6-21)
- Fix a bug with some promql queries that could result in values over 100%
1.9.18 (2022-6-21)
- Fix a bug with settting default alert rules in Grafana v9
1.9.17 (2022-6-9)
- Handles a breaking change in the alerting api for Grafana v9
1.9.16 (2022-6-3)
- Adds a more helpful error message when probe deletion fails
1.9.15 (2022-4-28)
- Fixes a routing issue where the unprovisioned plugin could get stuck in an infinite loop
- Fixes a routing issue where the plugin could prevent navigation to other parts of Grafana
1.9.14 (2022-4-15)
- Fixes a bug where there alerting tab could end up in a disabled state when it shouldn't
1.9.13 (2022-3-29)
Bug fixes
- Fixes reachability queries that could sometimes be over 100% for long time windows
- Hides dashboard update modal from users that don't have permissions to update dashboards
1.9.12 (2022-3-16)
Bug fixes
- Dashboard maps weren't displaying thresholds correctly
- Show custom alert thresholds in the check editor form
1.9.11 (2022-3-3)
Bug fixes
- Fix broken dashboard redirect logic
1.9.10 (2022-2-16)
Bug fixes
- Use datasource UIDs when creating dashboards instead of names
- Fix a potential infinite routing loop when initializing on prem
1.9.9 (2022-2-04)
Features
- Rearranged checklist filters under a central dropdown
1.9.8 (2022-2-01)
1.9.7 (2022-1-25)
Features
- Adds a map to the probe edit page to visualize longitude & latitude
1.9.6 (2022-1-21)
Features
- Increase the maximum quantity of labels per check to 10.
1.9.5 (2022-1-21)
Bug fixes
- Fix a race condition that prevented values from showing up when navigating to the edit check form
1.9.4 (2022-1-19)
Bug fixes
- Update routing to use React router
- Fix a bug in the usage prediction calculation
- Accessibility fixes
Features
- Include traceroute checks in the Terraform config export
1.9.3 (2022-1-10)
Bug fixes
- Gracefully handle inability to connect to API
1.9.2 (2022-1-06)
Features
- Added the ability to bulk edit probes for checks
1.8.1 (2022-1-04)
Bug Fixes
- Update the README with additional configuration details
1.8.0 (2022-1-04)
Features
- Add a
terraform importcommand to the terraform config download. This allows users to generate intial TF state.
Bug Fixes
- Replace worldmap panel plugin with geomap panel in all the dashboards
- Use the updated timeseries panel in the summary dashboard
- Rename the DNS dashboard to align with the other dashboards
1.7.0 (2021-12-01)
Features
- Add the ability to export checks and probes as terraform config from the plugin config page
- Add a button to generate a new API key in the plugin config page
1.6.0 (2021-11-17)
Features
- Add traceroute check type
1.5.6 (2021-11-15)
Bug Fixes
- Add data points per minute to usage calculator
1.5.5 (2021-10-29)
Features
- Mark deprecated probes as such in check editor. Prevent adding deprecated probes to checks.
1.5.3 (2021-09-20)
Bug Fixes
- Fix a dashboard config error
1.5.2 (2021-09-20)
Bug Fixes
1.5.1 (2021-09-14)
Bug Fixes
1.5.0 (2021-09-13)
Features
- add a homepage (625beb9)
1.4.0 (2021-09-08)
Features
1.3.2 (2021-09-08)
Bug Fixes
1.3.0 (2021-08-27)
Bug Fixes
- go back to circle bild (7d159fa)
Features
[1.2.30] - 2021-08-27
- New start to changelog with updated build process