Plugins 〉Splunk


Splunk
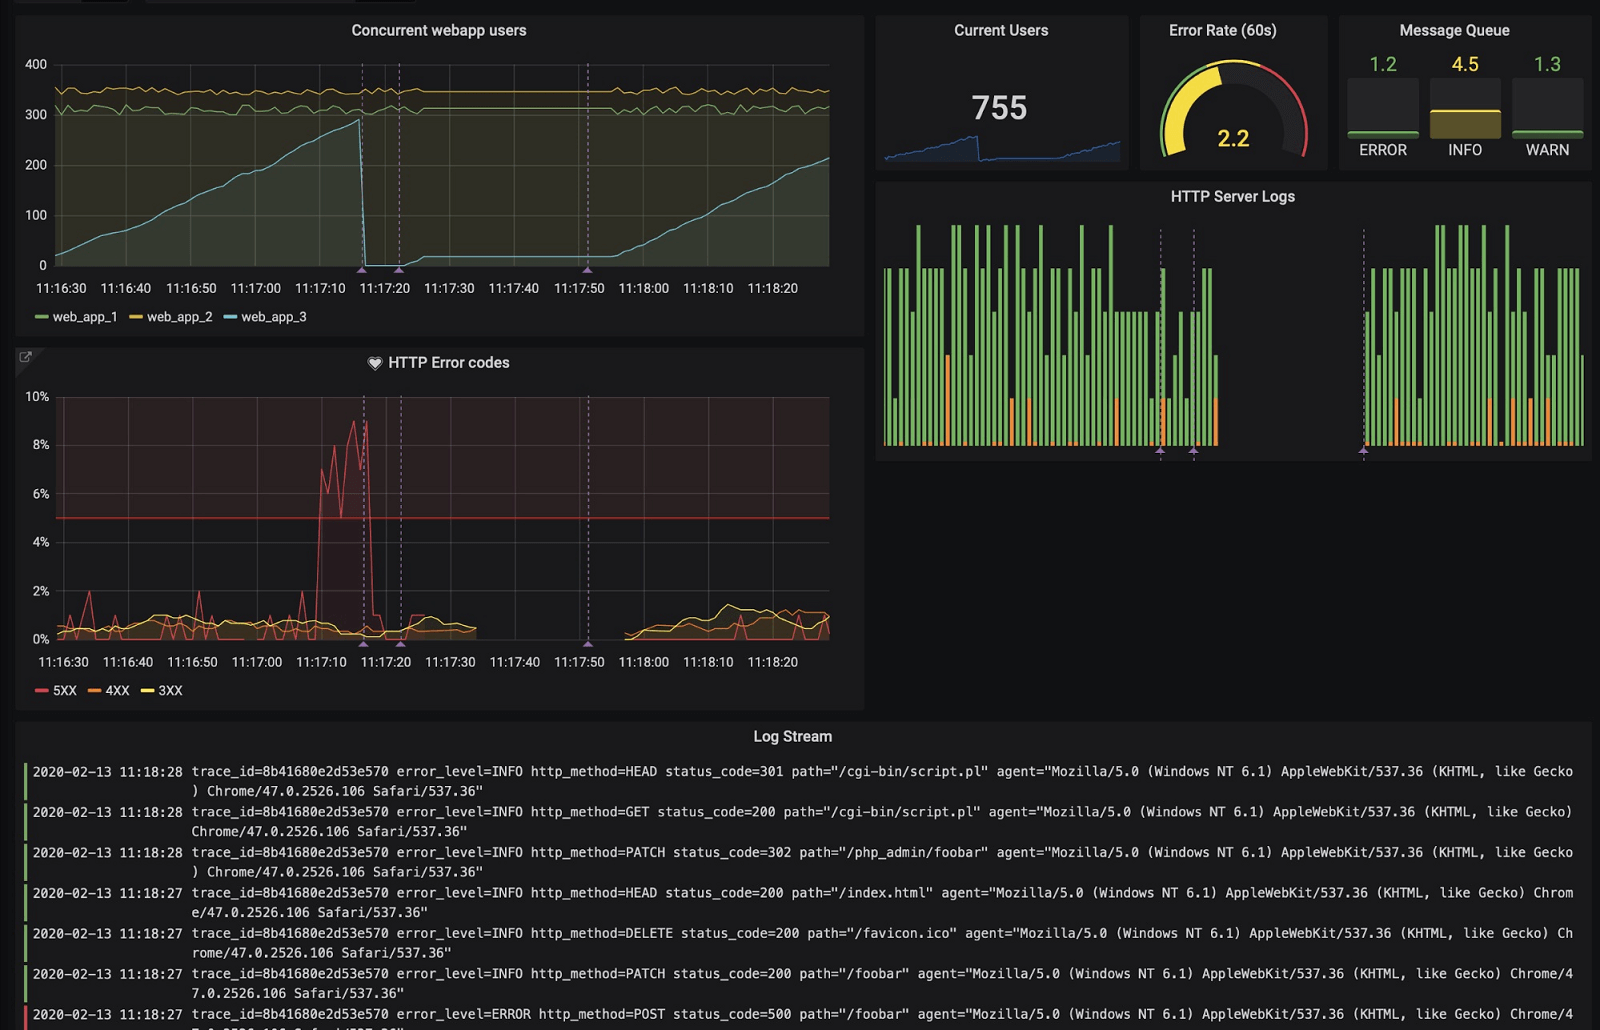
Instantly visualize Splunk data in Grafana
The Splunk data source plugin is the easiest way to pull Splunk data directly into Grafana dashboards.
- Visualize it either in isolation (one database) or blend it with other data sources.
- Discover correlations and covariances across all your data in minutes.
Grafana Cloud Free
- Free tier: Limited to 3 users
- Paid plans: $55 / user / month above included usage
- Access to all Enterprise Plugins
- Fully managed service (not available to self-manage)
Self-hosted Grafana Enterprise
- Access to all Enterprise plugins
- All Grafana Enterprise features
- Self-manage on your own infrastructure
Install on Grafana Cloud
Plugins can be installed directly from within your Grafana instance or automated using the Cloud API or Terraform.
Learn more about plugin installationMarketplace plugins
This is a paid plugin developed by a marketplace partner. To purchase an entitlement, sign in first, then fill out the contact form.
Get this plugin
This is a paid for plugin developed by a marketplace partner. To purchase entitlement please fill out the contact us form.
What to expect:
- Grafana Labs will reach out to discuss your needs
- Payment will be taken by Grafana Labs
- Once purchased the plugin will be available for you to install (cloud) or a signed version will be provided (on-premise)
Thank you! We will be in touch.
For more information, visit the docs on plugin installation.
Installing on a local Grafana:
For local instances, plugins are installed and updated via a simple CLI command. Plugins are not updated automatically, however you will be notified when updates are available right within your Grafana.
1. Install the Data Source
Use the grafana-cli tool to install Splunk from the commandline:
grafana-cli plugins install The plugin will be installed into your grafana plugins directory; the default is /var/lib/grafana/plugins. More information on the cli tool.
Alternatively, you can manually download the .zip file for your architecture below and unpack it into your grafana plugins directory.
Alternatively, you can manually download the .zip file and unpack it into your grafana plugins directory.
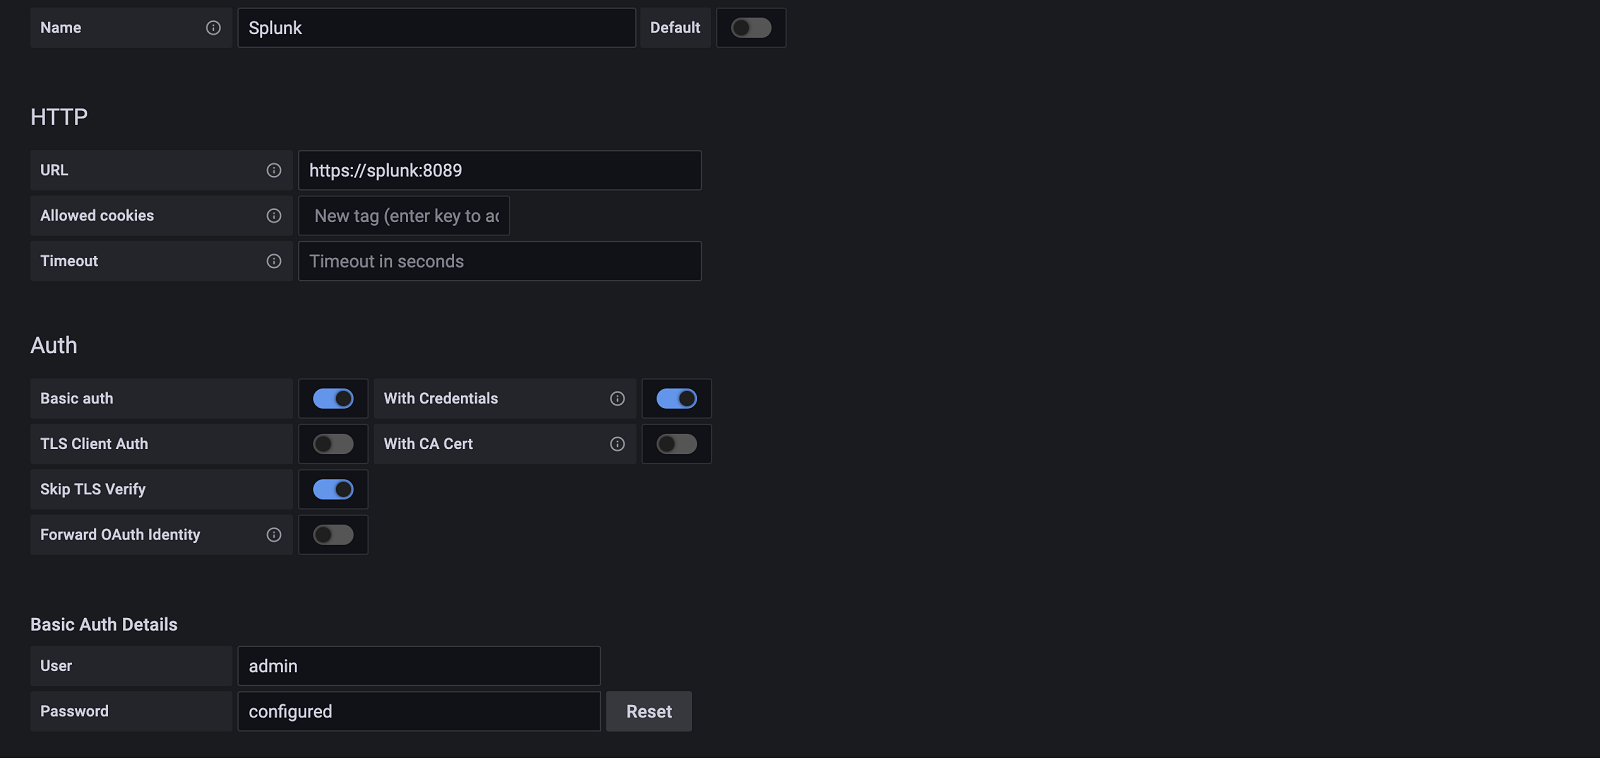
2. Configure the Data Source
Accessed from the Grafana main menu, newly installed data sources can be added immediately within the Data Sources section.
Next, click the Add data source button in the upper right. The data source will be available for selection in the Type select box.
To see a list of installed data sources, click the Plugins item in the main menu. Both core data sources and installed data sources will appear.
Changelog
5.8.24
Patch Changes
- ⚙️ Enhancement: Use Splunk's v2 search result endpoints by default
5.8.23
- ⚙️ Chore: Backend dependencies updated
5.8.22
Patch Changes
- 43f152b: ⚙️ Enhancement: Use Splunk's
dispatchStateas the canonical search-job state inGetSearchJobStatus, foldingDONE/PAUSE/terminal-cancel states into the existingisDone/isPaused/isFailedbooleans so the plugin stays consistent when Splunk's convenience booleans lag the dispatchState on the search head. The upstream HTTP status code is also now propagated instead of hardcoding success values.
5.8.21
- ⚙️ Chore: New Go version supported
5.8.20
- ⚙️ Chore: New Go version supported
5.8.19
- 1972d69: 🐛 Fix: Prevent panic in
GetSearchJobStatuswhen the Splunk job-status endpoint returns an unexpected response shape (error-shaped bodies, missingentrykey, empty arrays, truncated/malformed JSON). The parse now uses a typed struct and attributes unexpected shapes as downstream errors.
v5.8.18 - 2026-04-15
- ⚙️ Chore: Update dependencies
v5.8.17 - 2026-03-06
- ⚙️ Chore: Update dependencies
v5.8.16 - 2026-02-26
- ⚙️ Chore: Update dependencies
v5.8.15 - 2026-01-16
- ⚙️ Chore: Improve logging
v5.8.14 - 2025-12-08
- ⚙️ Chore: Improve logging
v5.8.13 - 2025-12-03
- ⚙️ Chore: Update frontend dependencies
- ⚙️ Chore: Minimal supported Grafana version is now
11.6.7
v5.8.12 - 2025-11-26
- 🐛 Fix: Fixed queries in query inspector for asynchronous mode
v5.8.11 - 2025-11-20
- 🐛 Fix: Fixed queries hanging when data source is set to Mixed
v5.8.10 - 2025-11-12
- 🐛 Fix: Fixed field length error that prevented results from displaying
v5.8.9 - 2025-11-05
- 🐛 Fix: Fixed row count in query inspector disappearing for async queries
v5.8.8 - 2025-11-04
- ⚙️ Chore: Improve logging
v5.8.7 - 2025-10-23
- 🐛 Fix: Fixed Variable Search Query
v5.8.6 - 2025-10-09
- 🐛 Fix: Fixed Variable Definition Appearance
v5.8.5 - 2025-08-22
- ⚙️ Chore: Improve logging
v5.8.4 - 2025-08-19
- 🐛 Fix: Fixed issue where query variable doesn't expand properly with IN operator
v5.8.3 - 2025-08-04
- 🐛 Fix: Align variable editor height with context on load
v5.8.2 - 2025-08-04
- 🐛 Fix: Use correct component for textarea variables
v5.8.1 - 2025-08-01
- ⚙️ Chore: bump backend dependencies
v5.8.0 - 2025-07-29
- 🐛 Fix: fix panic on cancelled async requests
v5.7.3 - 2025-06-12
- 🐛 Fix: Fix loading namespaces
v5.7.2 - 2025-06-09
- 🐛 Fix: Fix links in the config tooltips
- ⚙️ Chore: Update backend dependencies
v5.7.1 - 2025-05-19
- 🐛 Fix: Fix dashboard variables
v5.7.0 - 2025-05-09
- 🚀 Feature: Add support for OAuth token forwarding
v5.6.3 - 2025-04-28
- 🐛 Fix: Fix visualization of dashboard variables in variable list page
v5.6.2 - 2025-03-26
- 🐛 Fix: Handle 405 due to splunk restarts on create job as downstream errors
v5.6.1 - 2025-02-26
- 🐛 Fix: Fix support for Async enabled queries in alerts
v5.6.0 - 2025-02-25
- 🐛 Fix: Fix handling 204 statuses from the API
v5.5.4 - 2025-02-20
- ⚙️ Chore: Improve logging
v5.5.3 - 2025-02-20
- ⚙️ Chore: Improve logging
v5.5.2 - 2025-02-17
- ⚙️ Chore: Improve error logging
v5.5.1 - 2025-02-14
- 🐛 Fix: Improve escaping query JSON
v5.5.0 - 2025-02-13
- 🐛 Fix: Fix handling incorrect JSON in queries
v5.4.4 - 2025-02-11
- ⚙️ Chore: Update backend dependencies
v5.4.3 - 2025-02-04
- ⚙️ Chore: Update frontend dependencies
v5.4.2 - 2025-01-28
- ⚙️ Chore: Improve logging
v5.4.1 - 2025-01-10
- ⚙️ Chore: Update backend dependencies
v5.4.0 - 2024-12-18
- ⚙️ Chore: Update backend dependencies
- ⚙️ Chore: Update error source implementation
v5.3.2 - 2024-12-18
- 🧪 Tests: migrate tests to
@grafana/plugin-e2e
v5.3.1 - 2024-12-16
- ⚙️ Chore: Update backend dependencies
v5.3.0 - 2024-12-02
- 🚀 Feature: Add basic support for cookie forwarding
v5.2.0 - 2024-11-28
- ⚙️ Chore: Bump backend dependencies
v5.1.2 - 2024-11-21
- 🐛 Fix: Improve handling errors
v5.1.1 - 2024-11-12
- ⚙️ Chore: Updated backend dependencies
v5.1.0 - 2024-10-24
- 🚀 Feature: Introduce recovery from panic errors when requesting resources
v5.0.1 - 2024-10-03
- ⚙️ Chore: Update frontend dependencies
- ⚙️ Chore: Minimal supported Grafana version is now
10.4.8
v5.0.0 - 2024-09-24
- ⚙️ Chore: Introduce advanced error recovery and various asynchronous queries improvements
v4.15.1 - 2024-09-23
- ⚙️ Chore: Update backend dependencies
v4.15.0 - 2024-09-12
- 🚀 Feature: Remove toggle for advanced options
v4.14.1 - 2024-09-12
- ⚙️ Chore: Update backend dependencies
v4.14.0 - 2024-09-11
- ⚙️ Chore: Add error source to responses
- ⚙️ Chore: Update backend dependencies
v4.13.0 - 2024-09-02
- 🐛 Fix: Fix a bug with long running queries with preview enabled
- ⚙️ Chore: improve stability and performance of http connections
v4.12.3 - 2024-08-30
- ⚙️ Chore: update backend dependencies
v4.12.2 - 2024-08-22
- 🐛 Fix: Ignore query limit if advanced option toggle is off
v4.12.1 - 2024-08-20
- 🐛 Fix: Fix configuration result limit
v4.12.0 - 2024-07-26
- ⚙️ Chore: Update backend dependencies
v4.11.0 - 2024-07-22
- 🐛 Fix: Fix setting the basicAuth on the plugin
- 🐛 Fix: Fix saving config settings
v4.10.1 - 2024-07-09
- 🐛 Fix: Fix license check
v4.10.0 - 2024-07-05
- 🚀 Feature: Add configurable timeout in the data source config
v4.9.0 - 2024-07-02
- ⚙️ Chore: Added SLO metrics to the plugin
v4.8.1 - 2024-06-19
- ⚙️ Chore: update backend dependencies
v4.8.0 - 2024-05-29
- ⚙️ Chore: update backend dependencies
v4.7.0 - 2024-05-22
- ⚙️ Chore: Refactor the config page
- ⚙️ Chore: Update backend libraries
v4.6.2 - 2024-03-13
- ⚙️ Chore: Backend binaries are now compiled with Go version
1.22.1
v4.6.1 - 2024-01-25
- 🐛 Fix: Fix authentication error
v4.6.0 - 2024-01-17
- ⚙️ Chore: Return error source with query errors
v4.5.2 - 2023-12-18
- 🐛 Fix: Fix for rendering public dashboards
v4.5.1 - 2023-12-13
- 🐛 Fix: Fix sharing public dashboards
v4.5.0 - 2023-12-06
- ⚙️ Chore: Update backend and frontend packages
v4.4.0 - 2023-11-03
- ⚙️ Chore: Fix security vulnerabilities
v4.3.4 - 2023-10-20
- 📝 Documentation: Update online docs
v4.3.3 - 2023-09-19
- ⚙️ Chore: migrate to create-plugin
v4.3.2 - 2023-08-17
- ⚙️ Chore: Backend binaries are now compiled with Go version 1.21
v4.3.1 - 2023-08-10
- ⚙️ Chore: update dependencies
v4.3.0 - 2023-06-13
- 🚀 Feature: Added support for configuring global result limit
v4.2.2 - 2023-06-12
- 🐛 Fix: only fetch suggestions for non-empty queries
v4.2.1 - 2023-06-08
- ⚙️ Chore: backend libs updated with golang:1.20.5
v4.2.0 - 2023-05-24
- Update the UI of the config page and clean up the documentation
v4.1.10 - 2023-05-17
- Prevent unnecessary query run when query editor is rendered
v4.1.9 - 2023-05-04
- 🐛 Fix: Fixed issue with "No data" returned when "Poll result" or "Preview mode" were enabled
v4.1.8 - 2023-05-03
- ⚙️ Chore: Backend binaries are now compiled with golang 1.20.4
v4.1.7 - 2023-04-14
- 🐛 Fix: Fixed a bug where annotation queries didn't pass the namespace value
- ⚙️ Chore: Backend binaries are now compiled with golang 1.20.3
v4.1.6 - 2023-03-13
- 🐛 Fix: Fixed a "Data source not found" error
v4.1.5 - 2023-03-10
- 🐛 Fix: Fixed a bug when request errors were not shown on the panel
v4.1.4 - 2023-03-08
- 🐛 Fix: Fixed a bug when plugin was producing errors when requesting a big amount of data
v4.1.3 - 2023-02-24
- 🐛 Fix: Fixed a bug where the plugin failed to execute queries in Grafana version 9.4.0 and above
v4.1.2 - 2023-02-22
- 🐛 Fix: Fix query request using old datasource string format
v4.1.1 - 2023-02-21
- Fixed issue with appending nil frame
v4.1.0 - 2023-01-04
- Fixed wrong color theme on annotation editor input fields
- Migrate angular annotation editor to react
v4.0.6 - 2022-12-15
⚙️ Chore: Backend binaries are now compiled with the latest go version (1.19.4)
⚙️ Chore: Grafana dependencies are updated to latest version
⚙️ Chore: Add spellcheck + fix typos
Updated datasource instance init
v4.0.5 - 2022-10-28
- Updated datasource instance init
v4.0.4 - 2022-10-28
- Updated postman collection and contributing guide how to use
v4.0.3 - 2022-09-22
- Fixed a bug where the first time loading a query would sometimes error. This was due to a sending a nil response to httputil.DumpResponse
v4.0.2 - 2022-09-21
- Fixed a bug where health check was failing due to incorrect response format
v4.0.1 - 2022-08-25
- Enhanced request and response debug logging
v4.0.0 - 2022-07-12
- Token authentication method added
- BREAKING CHANGE: Session key clustering strategy / authentication method removed
v3.1.0-beta.1 - 2022-06-12
- Added support for HTTP logger
- Added support for multiple data links
v3.0.2 - 2022-04-20
- Handle null namespace values
v3.0.1 - 2022-03-29
- New builds with go 1.18 to address CVE-2022-24921
v3.0.0 - 2021-01-18
- Minimum supported Grafana version is now set to v8.2.0
- Support sample ratio in explore view URLs
- Fixes an issue with data link support in dashboard panels
v2.2.3 - 2021-12-17
- Enterprise license check update
v2.2.2 - 2021-12-14
- Values for template variables can now be numbers.
v2.2.1 - 2021-11-23
- Fixed an issue with escaping wildcards in queries with template variables
- Fixed an issue with applying defaults for Preview Mode and event sampling
v2.2.0 - 2021-11-01
- Added support for multi-value fields
- Added support for event sampling
- Added support for navigating from Prometheus metrics to Splunk logs in Explore
- Renamed Stream Mode to Preview Mode
- Fixed an issue with Preview Mode that prevented the display of partial results
- Prevent internal field filters from being applied to dashboard variable queries
- Improved query processing performance by 38 percent and reduced memory usage by 50 percent
- Fixed invalid output in
mstatsqueries
v2.1.7 - 2021-09-08
- Fixed issue that would filter internal fields even if internal field filtering was disabled
v2.1.6 - 2021-08-04
- Documentation update
v2.1.5 - 2021-07-30
- Fixed issue where alerting queries don't filter out internal fields
- Results that return data in multiple different types are typed as string
v2.1.4 - 2021-06-02
Bug Fixes
- #278: 'No data' displayed for Grafana 8
v2.1.3 - 2021-05-27
Bug Fixes
- #265: Errors returned when in polling mode cause the driver to crash
- #226: Filter fields prefixed with _ if filtration is on
v2.1.2 - 2021-04-12
- ⚙️ Chore: Update SDK
v2.1.1 - 2020-04-06
Bug Fixes
- #254: To template variables properly, splunk should be passing in scopedvars into the templating engine
- #224: Splunk executes queries that have hide = true (the eye icon)
- #222: Get the splunk changelog to publish to GCOM by upgrading to the "next" toolkit"
- #246: Splunk should not refresh the query immediately after every pause in typing/editing the query
- #239: Enable E2E tests
- #215: "Skip TLS Verify" option not working
- #213: "Post forbidden" error after upgrading to 2.0.4
- #208: Update to new SDK to support individual plugin licensing
v2.1.0 - 2020-01-25
Bug fixes
- #212: Return all indexes
- #235: Better handle edge cases
- #236: Better handle an out-of-bounds error
Enhancements
- #187: Update README
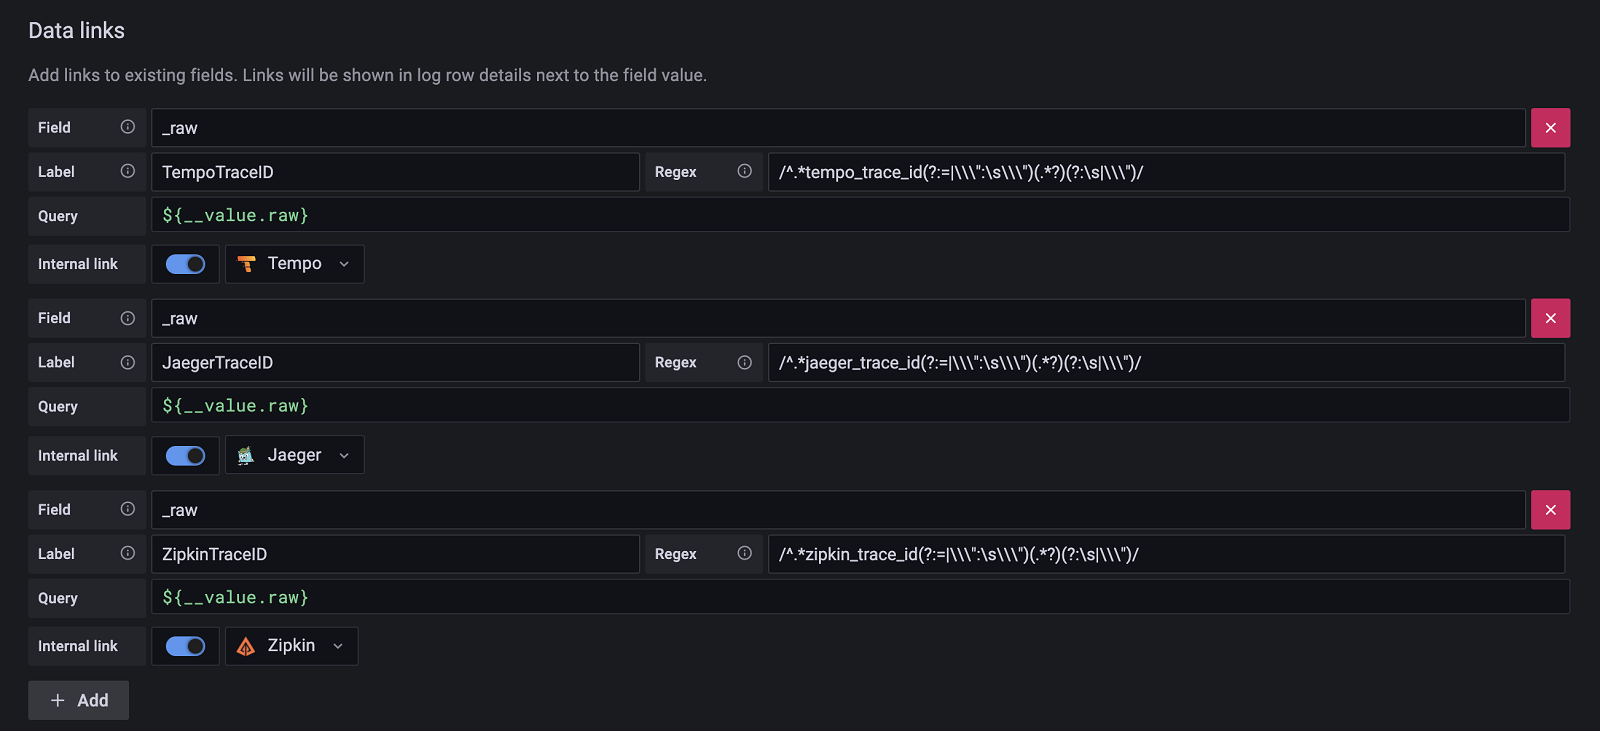
- #210: Link from logs to traces using data links or derived fields
Known issues
- You must use
//around regular expressions in the datalinks configuration or any plugin health check will fail. When a regular expression is optional, use an empty//.
v2.0.5 - 2020-12-11
Bug fixes
- #214: Time filters not working for Splunk queries in dashboard variables
- #210,#209: Plugin crashes a lot while trying out queries
v2.0.4 - 2020-10-27
- 🐛 Fix: If session key is empty, still valid
- Enhancement: When using splunk in clustered mode, allow user to revert to 'basic auth'
v2.0.3 - 2020-10-19
- 🐛 Fix: Fix for proxy settings, now will recognize standard "http_proxy" "https_proxy" and "no_proxy" environment variables
- TLS Skip Verification now performs verification when not checked
v2.0.2 - 2020-09-10
- 🐛 Fix: Fix for time range issue #184
v2.0.1 - 2020-06-01
Issues Resolved
v2.0.0 - 2020-05-22
- Rewritten as a backend plugin with native alerting support
- Removed distinction between table & time_series results
- Signed version for grafana 7.x
v1.5.0 - 2020-05-17
- Signed release for Grafana 7.x
v1.4.1 - 2020-01-10
Fixed
- "Unbalanced quotes" error when using variables in some scenarios
- Logs panel does not show data in logs format
- Query returns only first 100 points
v1.4.0 - 2019-11-26
Added
- Explore logs integration
v1.3.4 - 2019-11-22
Fixed
- Plugin failed with "Unexpected token <" error
v1.3.3 - 2019-11-21
Fixed
- Query in template variable with no result data is running forever #82
v1.3.2 - 2019-10-03
Fixed
- Plugin failed in Grafana 6.4 with error "Unexpected token <"
v1.3.1 - 2019-10-01
Fixed
- Streaming support in Grafana 6.4 (incompatible with previous version)
v1.3.0 - 2019-07-30
Added
- Variable query editor with namespace support, #63
Fixed
- Streaming support in Grafana 6.3
v1.2.2 - 2019-06-29
Fixed
- Bug with semicolon in query, #57
- Variable expansion when concatenated with literal string, #58
- Variable expansion when there is a period character in the name, #59
v1.2.1 - 2019-03-18
Fixed
v1.2.0 - 2019-02-01
Added
Fixed
- Table panel is empty after update to v1.1.0, #34
- Panel is not refreshing on leaving search field, #40
v1.1.0 - 2018-11-14
Added
- Multi-value template variables support, #2
- Use time range for variable queries if Refresh option set to On Time Range Change
- Option for variables search mode in datasource config (fast/smart/verbose)