
Plugins 〉DBeast Monitor for Elastic Stack


DBeast Monitor for Elastic Stack


"DBeast monitor" toolkit for Elastic Stack
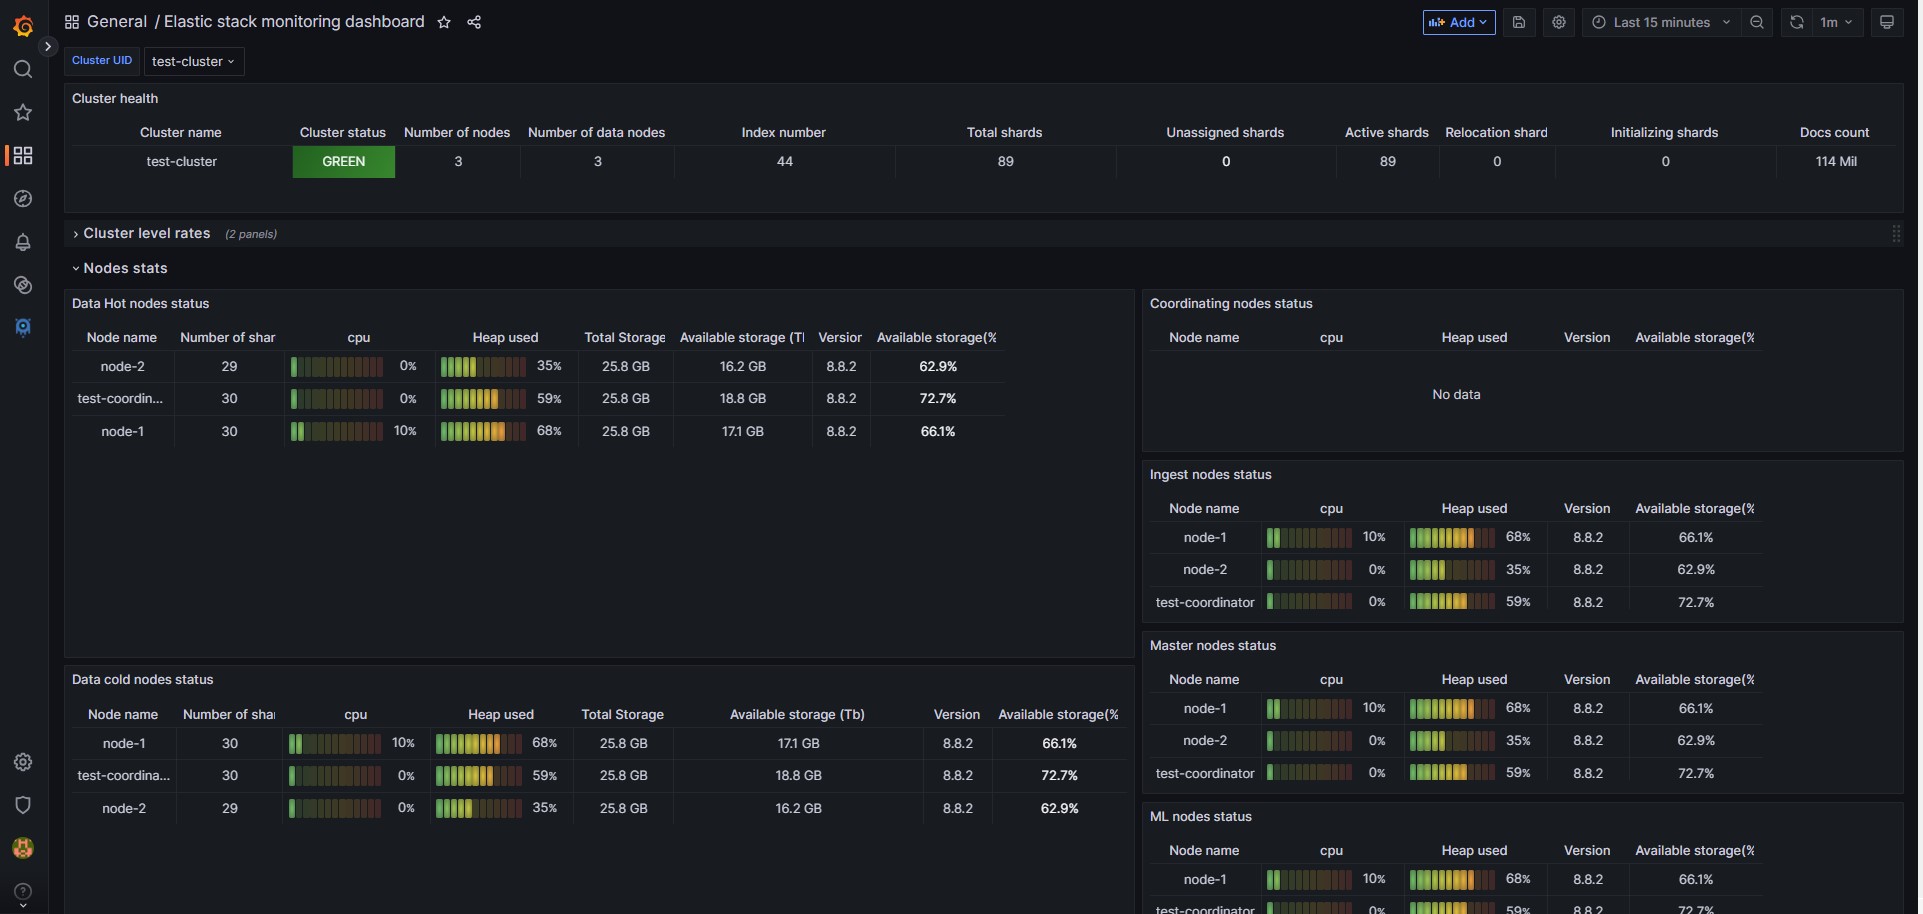
Welcome to the DBeast Monitor for Elastic Stack – an open-source plugin for Grafana!
Our plugin provides a powerful UI for monitoring, analyzing, and optimizing of your Elastic Stack components - Elasticsearch, Logstash, and Kibana.
Key features
- Multi-cluster support – monitor and manage multiple Elasticsearch clusters from a single application.
- Comprehensive dashboards providing monitoring and analytics for:
- Elastic Stack overview
- Elasticsearch hosts performance and health
- Elasticsearch Indices / index patterns usage and metrics
- Elasticsearch shards distribution and allocation
- Elasticsearch ingest pipelines activity and throughput
- Elasticsearch tasks progress and status
- Elasticsearch machine learning jobs performance and status
- Logstash instances performance and health
- Logstash pipelines throughput and errors
- Helm versions
- Currently, there is no Helm charts for the versions 2+
- The Helm charts for the previews versions can be found in our Helm repository
Documentation
The project documentation is available on our wiki.
Getting started
- Regular (OnPrem) installation:
The OnPrem version includes only the application plugin. You will need to install and define Logstash separately for data shipment. The complete installation guid can be found in our OnPrem installation instructions. - The user guid for the adding new cluster can be found in the OnPrem Add new cluster instructions.
Requirements
- Grafana: 10.1.0+
- Logstash: 8.1+
- Elasticsearch monitored cluster: 8+ (Elasticsearch 7X - partial support)
- Elasticsearch monitoring cluster: 8.7+
Enterprise Support
Need expert help with Elastic Stack architecture, performance tuning, monitoring, or solving complex challenges? Our team provides hands-on guidance and tailored solutions for your environment.
📩 Get in touch: support@dbeast.co
For Contributors & Sponsors
We’re always looking for passionate contributors and sponsors to help us improve and grow the application. Whether you want to contribute code, share ideas, or support the project financially — your help makes a difference.
📩 Reach out: support@dbeast.co
© 2022 - 2025 DBeast. All rights reserved
Grafana Cloud Free
- Free tier: Limited to 3 users
- Paid plans: $55 / user / month above included usage
- Access to all Enterprise Plugins
- Fully managed service (not available to self-manage)
Self-hosted Grafana Enterprise
- Access to all Enterprise plugins
- All Grafana Enterprise features
- Self-manage on your own infrastructure
Installing DBeast Monitor for Elastic Stack on Grafana Cloud:
Installing plugins on a Grafana Cloud instance is a one-click install; same with updates. Cool, right?
Note that it could take up to 1 minute to see the plugin show up in your Grafana.
Warning
Plugin installation from this page will be removed in February 2026. Use the Plugin Catalog in your Grafana instance instead. Refer to Install a plugin in the Grafana documentation for more information.
Installing plugins on a Grafana Cloud instance is a one-click install; same with updates. Cool, right?
Note that it could take up to 1 minute to see the plugin show up in your Grafana.
Installing plugins on a Grafana Cloud instance is a one-click install; same with updates. Cool, right?
Note that it could take up to 1 minute to see the plugin show up in your Grafana.
Warning
Plugin installation from this page will be removed in February 2026. Use the Plugin Catalog in your Grafana instance instead. Refer to Install a plugin in the Grafana documentation for more information.
Installing plugins on a Grafana Cloud instance is a one-click install; same with updates. Cool, right?
Note that it could take up to 1 minute to see the plugin show up in your Grafana.
For more information, visit the docs on plugin installation.
Installing on a local Grafana:
For local instances, plugins are installed and updated via a simple CLI command. Plugins are not updated automatically, however you will be notified when updates are available right within your Grafana.
1. Install the Application
Use the grafana-cli tool to install DBeast Monitor for Elastic Stack from the commandline:
grafana-cli plugins install The plugin will be installed into your grafana plugins directory; the default is /var/lib/grafana/plugins. More information on the cli tool.
Alternatively, you can manually download the .zip file for your architecture below and unpack it into your grafana plugins directory.
Alternatively, you can manually download the .zip file and unpack it into your grafana plugins directory.
2. Enable it
Next, log into your Grafana instance. Navigate to the Plugins section, found in your Grafana main menu.
Click the Apps tabs in the Plugins section and select the newly installed app.
To enable the app, click the Config tab. Follow the instructions provided with the application and click Enable. The app and any new UI pages are now accessible from within the main menu, as designed by the app creator.
If dashboards have been included with the application, they will attempt to be automatically installed. To view the dashboards, re-import or delete individual dashboards, click the Dashboards tab within the app page.
Changelog
Version 2.0.5 (2025-11-02)
Features:
- [FEAT] Add Disk read latency in the host overview #221
- [FEAT] Fix input URL in the "Index stats" ingest pipeline #227
- [FEAT] Add units to the "Cluster level stats" block in the "stack monitoring" #229
- [FEAT] Add the "Frozen tier" to the Stack monitoring dashboard#223
- [FEAT] Replace MUI library with the grafana/ui #225
Bug fixes
Version 2.0.4 (2025-10-28)
First release with Grafana signed plugin
- Features:
- Update plugin dependency @playwright/test to v1.56.1 due to a reported vulnerability issue
Version 2.0.3 (2025-10-26)
Important! This version is not backward compatible. Minimum Grafana Version updated to the 10.1
- Features:
- Refactoring based on the Grafana requirements
Version 2.0.0 (2025-08-09)
Important! This version is not backward compatible. Minimum Grafana Version updated to the 10.1
Features:
Updated dashboards
- All dashboards have been updated to align with the new features and compatibility.
Version 1.0.3 (2025-04-27)
Features:
- [FEAT] Add Logstash health_report API data to the Logstash dashboards #216
- [FEAT] In the Index pattern overview Add ingest rate without index name #211
- [FEAT] "Host overview" dashboard - server level changes #209
- [FEAT] Change the query date in the tasks dashboard #198
- [FEAT] "Elastic Stack Monitoring" in the "Nodes stats" block add available storage size in Bytes #45
- [FEAT] "Elastic Stack Monitoring" dashboard upgrades list #21
Bug fixes
- [BUG] Incorrect filter definition in the "Host overview" need to add cluster id #195
- [BUG] Fix time units in the "Tasks analytics" dashboard #207
- [BUG] Incorrect legend in the "Ingest rate" panel in the "Stack monitor" dashboard #208
- [BUG] Incorrect status visualization in case of the Elastic Cloud usage #212
- [BUG] In the "Logstash overview" and "Logstash node overview" dashboards replace logstash.elasticsearch.cluster.id #215
- [BUG] In the "Shards overview" remove limitations from the heatmaps #214
Updated dashboards
- All dashboards
Version 1.0.2 (2025-01-05)
Features:
- [FEAT] Add Flow parameters to the Logstash Host Overview dashboard #185
- [FEAT] Define all Date histogram graphs "Max data points" #186
- [FEAT] Update CPU utilization in the "Host overview" dashboard #203
- [FEAT] Change ingest rate fields in the "Stack monitoring" dashboard #199
- [FEAT] "Index monitor" dashboard upgrades list #36
- [FEAT] "Host overview" dashboard upgrades list #25
- [FEAT] Add the version number into the ES templates and logstash pipelines #205
Bug fixes
Updated dashboards
- All dashboards
Version 1.0.1 (2024-11-05)
Features:
Bug fixes
Updated dashboards
- Elastic stack monitor
- Host overview
- Elasticsearch shards overview
- Elasticsearch index pattern monitor
Version 1.0.0 (2024-09-23)
We released the first version for Kubernetes with Helm charts! Now we have Kubernetes and on-prem versions!
Features:
- [FEAT] Kubernetes image development #44
- [FEAT] Add storage and memory per tier status in the "Stack monitoring" dashboard #65
- [FEAT] Add deleted docs in the "Index status" #148
- [FEAT] Logstash index stats pipeline - add docs.deleted rates #133
- [FEAT] Logstash logs pipeline optimization #46
- [FEAT] Add storage and memory per tier status in the "Stack monitoring" dashboard #65
Bug fixes
- [BUG] Incorrect avg shard size in the "Index pattern monitor" dashboard #147
- [BUG] In the index summary there is no ingest rate data in case of the index closed #144
- [BUG] In the Thread pools mapping change fields type from the integer to the long #138
- [BUG] Incorrect rollover alias in the new index definition #137
Updated dashboards
- Elastic stack monitor
- Logstash overview
- Logstash instance monitor
- Logstash pipeline analytics
- Elasticsearch index monitor
Version 0.8.1 (2024-08-06)
Bug fixes
Features:
- [FEAT] Add corrupted data index for the TSDS Logstash configurations #112
Version 0.8.0
- All data sources have been updated to use aliases, directing them to Data Streams, TSDS, or Indexes.
- Note: There is no backward compatibility with the previous version.
- The minimum required version for the monitoring cluster is now 8.7. (Production clusters can still operate on older versions.)
Features:
- Application installer #37 Developed configurations downloader
- [FEAT] Metric indices to the TSDS migration #84
- [FEAT] Add ILM policies for all Index templates #32
- [FIX] Fix API requests in the "Cluster list"#23
- [FEAT] In the "Tasks API" flow fix running time units #92
- [FEAT] Logstash "Elasticsearch tasks" pipeline - Add ESQL tasks parsing #73
Bug fixes
Updated dashboards All dashboards updates to the aliases usage
Version 0.7.1
Bug fixes
Features
Updated dashboards
- Elasticsearch ingest pipeline overview
- Elasticsearch ingest pipeline analytics
- Elastic stack monitor
Version 0.7.0
Bug fixes
- Incorrect Aggregation of Pipeline Data in Logstash Overview Dashboard #48
New data sources:
- Elasticsearch Tasks API datasource
New dashboards:
- Elasticsearch Tasks analytics
Features
- The backend component moved to the Grafana plugin
Updated dashboards
- Elasticsearch host overview
- Elasticsearch index monitor
- Elastic stack monitor
- Logstash instance monitor
- Logstash overview
Version 0.6.1
- Bug fixes
- Incorrect host definition in the logstash-logs configuration file #43
Version 0.6.0
New data sources:
- Thread pools datasource
Updated dashboards
- Elasticsearch host overview
- Elasticsearch ingest pipelines overview
- Elasticsearch ingest pipeline analytics
- Elasticsearch index monitor
- Elasticsearch index patterns monitor
- Elastic stack monitor
- Logstash instance monitor
- Logstash overview
- Logstash pipeline analytics
- Elasticsearch shard level monitor
Version 0.5.1
- Fixed bug in the Logstash logs and metrics configuration files
Version 0.5.0
New data sources:
- Metricbeat + Monitoring datasource
- Logs datasource
- Elasticsearch Ingest pipeline datasource
New dashboards:
- Elasticsearch host overview
- Elasticsearch ingest pipelines overview
- Elasticsearch ingest pipeline analytics
- Elasticsearch index monitor
- Elasticsearch index patterns monitor
Updated dashboards
- Elastic stack monitor
- Logstash instance monitor
- Logstash overview
- Logstash pipeline analytics
- Elasticsearch shard level monitor
- Name conventions update
Version 0.4.0-RC
Initial release.