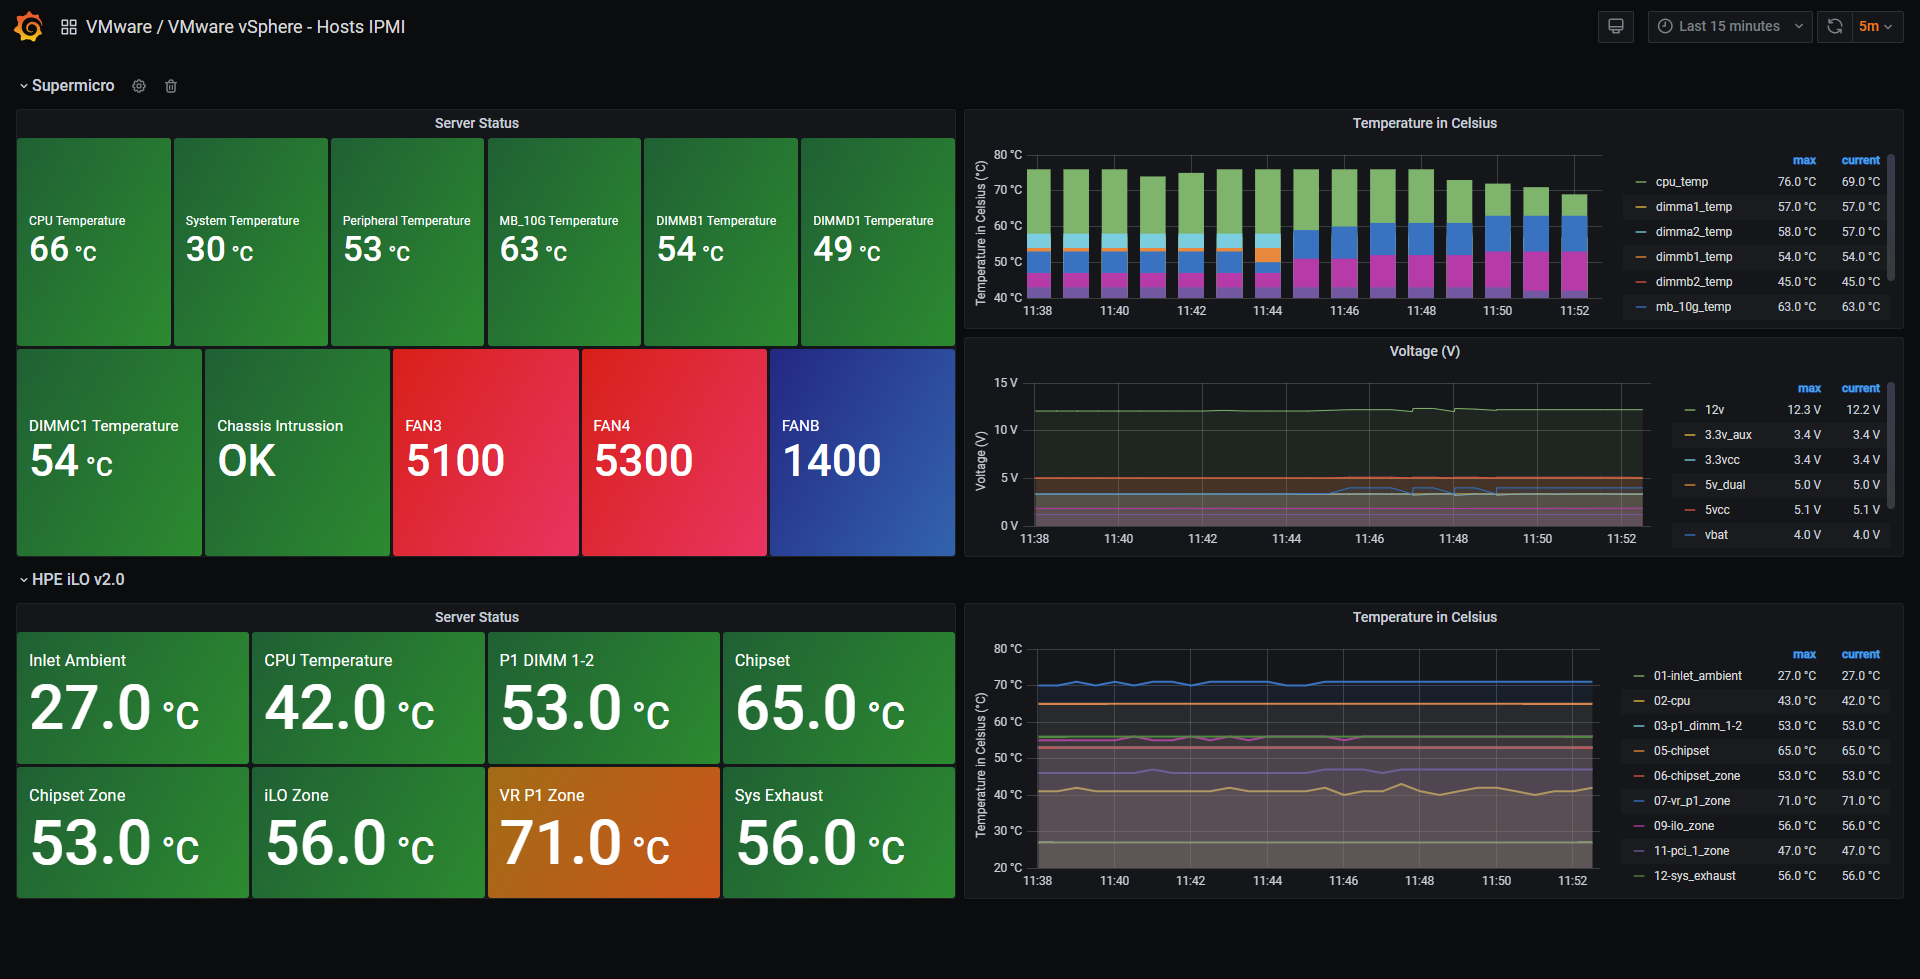
VMware vSphere - Hosts IPMI
VMware vSphere Dashboard using the Telegraf IPMI plugin (Grafana 7)
This dashboard contains the needed information to show the measurements of a n IPMI from Supermicro and HPE Servers using iLO. The Dashboard comes handy to have in one quick view deep visibility across different branches and vendors, and focus just on the health and status of the Infrastructure.
This Dashboard complements the previous four using the vSphere Telegraf input, so you can have a deep visibility of vSphere, follow the next links if you are interested in other monitoring like VMs CPU and RAM Usages, Storage, etc.
You should download as well the next Dashboards to have the full Hosts and Datastores visibility:
- Grafana vSphere Overview
- Grafana vSphere Datastore Dashboard
- Grafana vSphere Hosts Dashboard
- Grafana vSphere VMs Dashboard
Using the latest version of Telegraf should work, more information here

More information available in: https://jorgedelacruz.es
Measurements & Fields
- Temperature
- CPU
- RAM DIMM
- PCI
- Environment
- Voltage
- Chassis Intrusion
Data source config
Collector config:
Upload an updated version of an exported dashboard.json file from Grafana
| Revision | Description | Created | |
|---|---|---|---|
| Download |
VMware vSphere
Easily monitor VMware vSphere, a virtualization platform that helps consolidate IT infrastructure, with Grafana Cloud's out-of-the-box monitoring solution.
Learn more
