
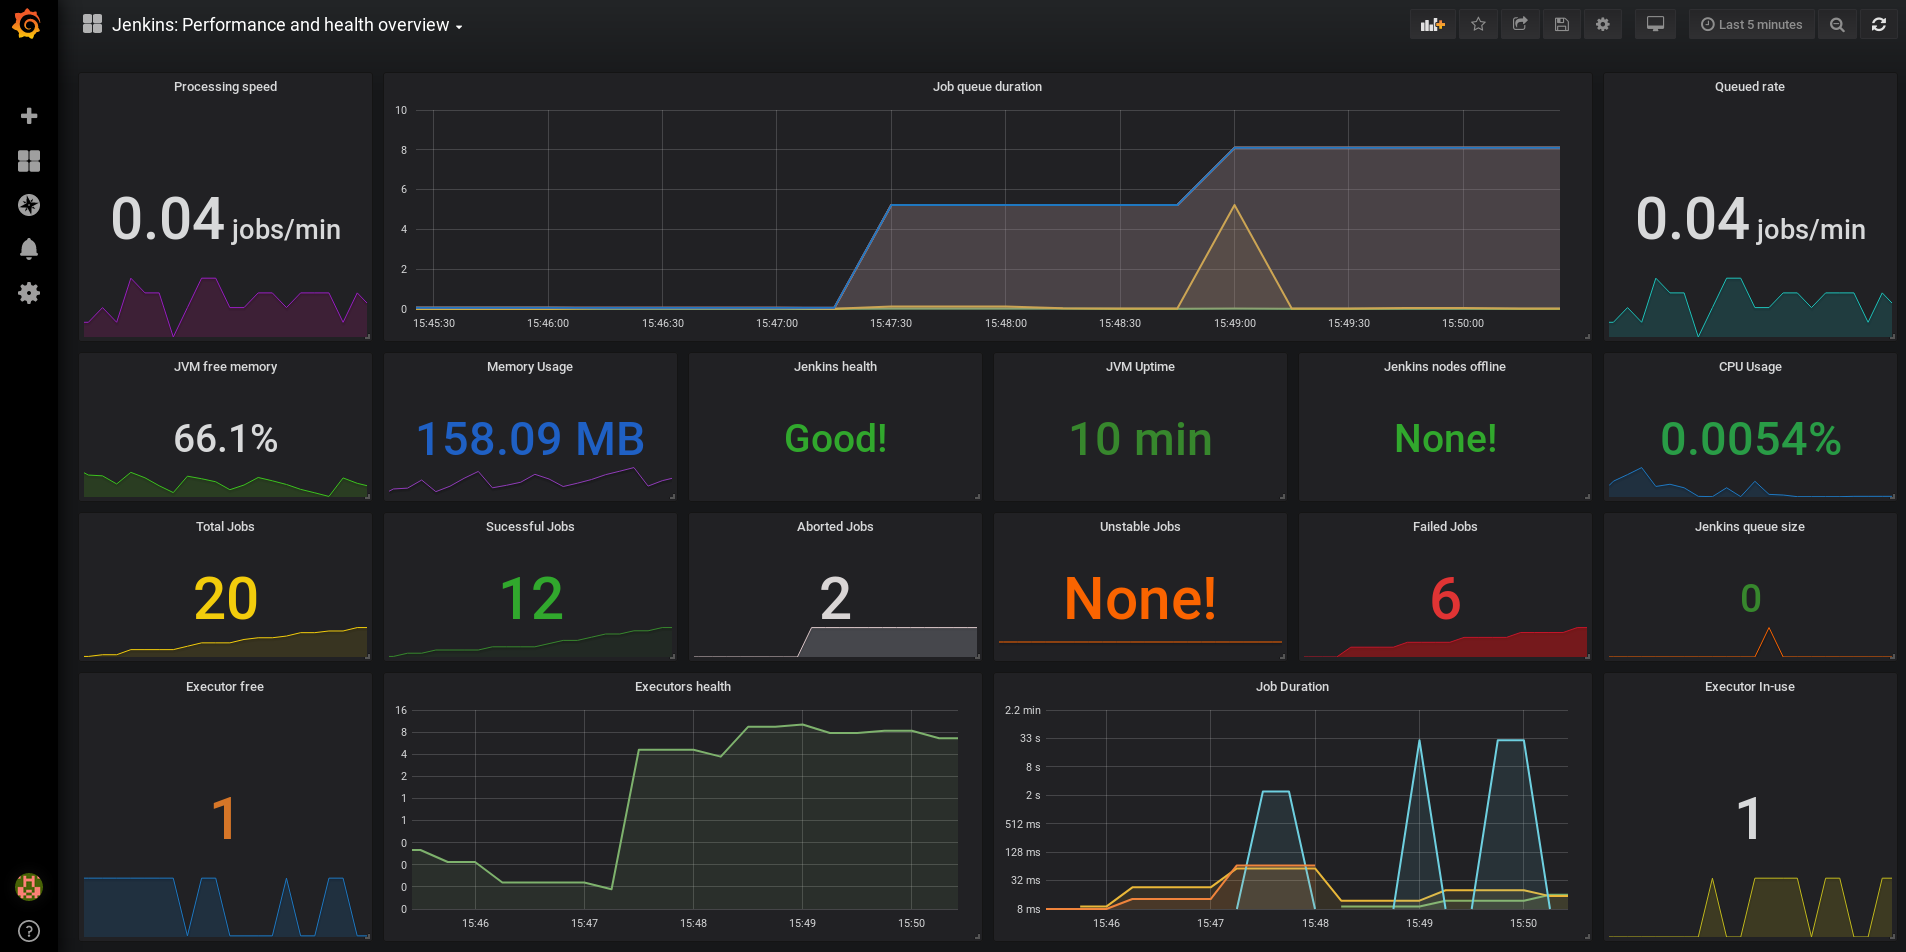
Jenkins: Performance and Health Overview
Jobs queue speeds and rates, Executors availability, Nodes status, Jenkins and JVM resource usage, Jenkins Job Status, and lot more.
Read Blog post about how to test setup with Vagrant which will install Prometheus Jenkins and Grafana.
{or}
Just install https://wiki.jenkins-ci.org/display/JENKINS/Prometheus+Plugin plugin for Jenkins, start monitoring it by your Prometheus and use this Grafana Dashboard for Jenkins.
Adjust it to your needs, make it better and share back with community.
Data source config
Collector type:
Collector plugins:
Collector config:
Revisions
Upload an updated version of an exported dashboard.json file from Grafana
| Revision | Description | Created | |
|---|---|---|---|
| Download |