
Microsoft Azure Storage
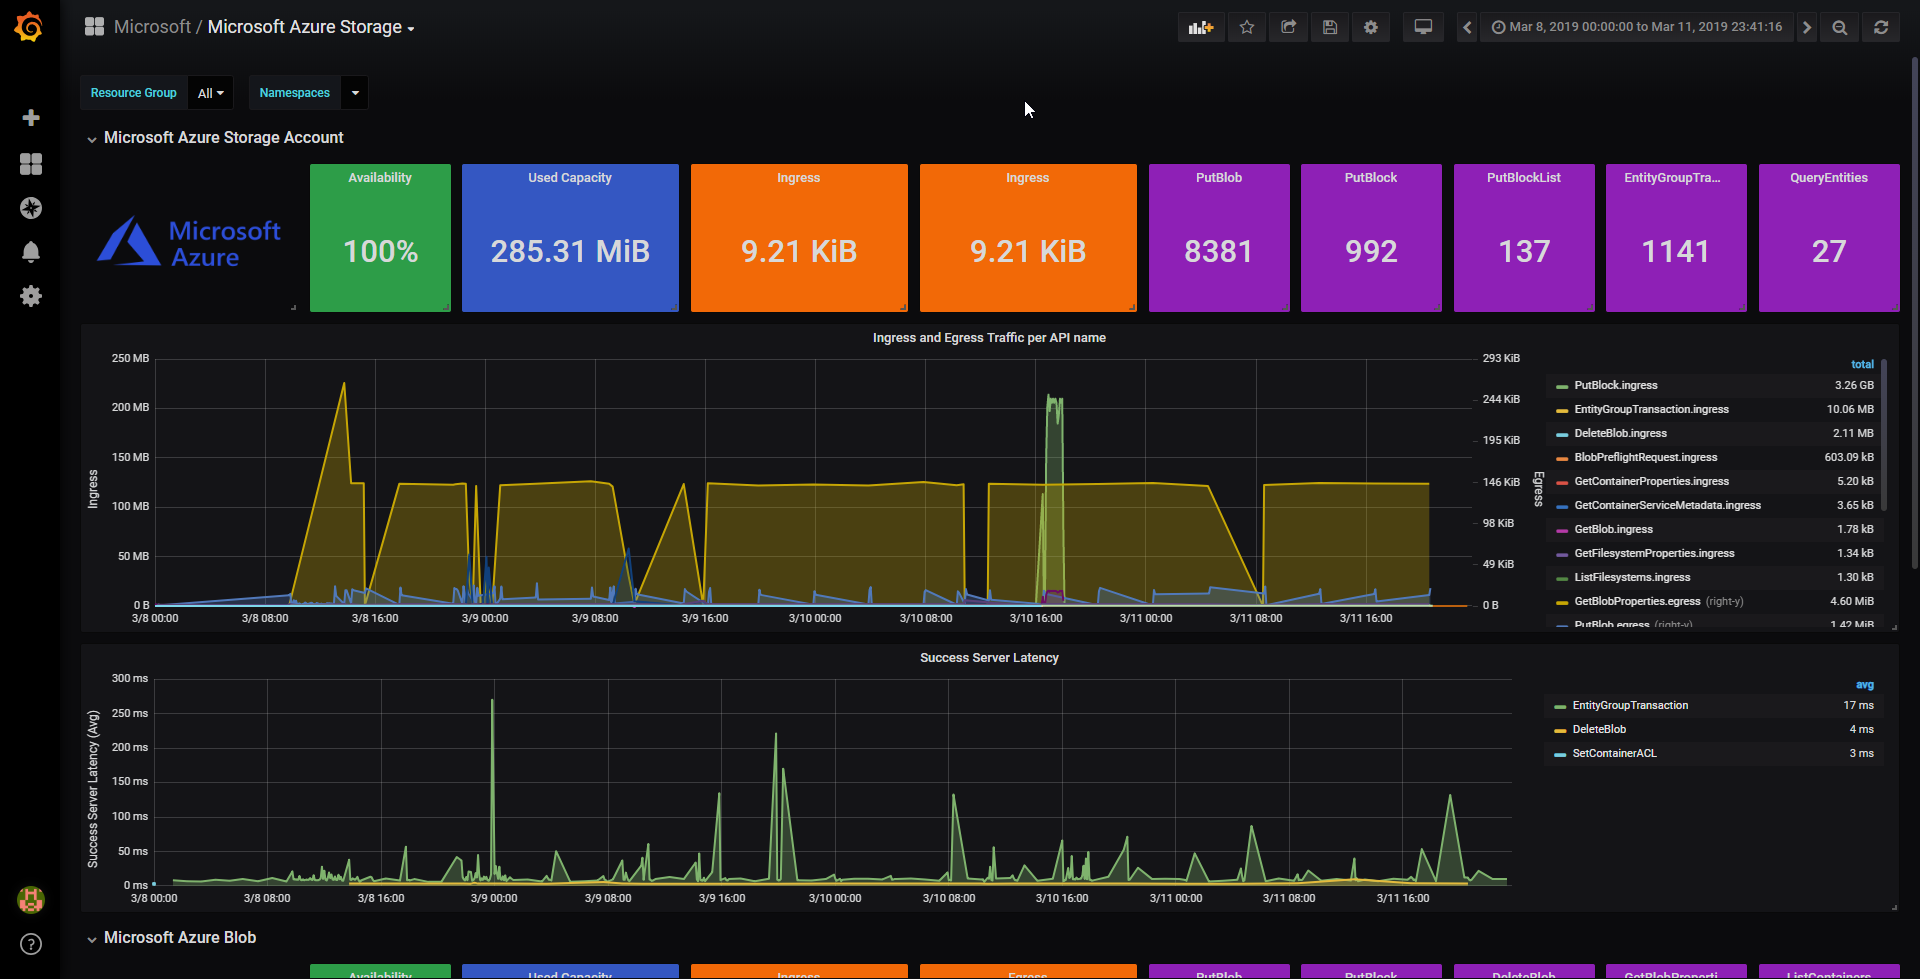
This Dashboard works out of the box while having all properly configured on Microsoft Azure Monitor, it does have insight into all the Storage accounts, and resources inside.
The Dashboard it is specially useful to track capacity, operations and latency to Microsoft Azure Storage.
Data source config
Collector type:
Collector plugins:
Collector config:
Revisions
Upload an updated version of an exported dashboard.json file from Grafana
| Revision | Description | Created | |
|---|---|---|---|
| Download |
Azure Cosmos DB
With the Grafana plugin for Azure Cosmos DB, you can quickly visualize and query your Azure Cosmos DB data from within Grafana.
Learn more