Spring Boot Application
Dashboard for Spring Boot application with Micrometer
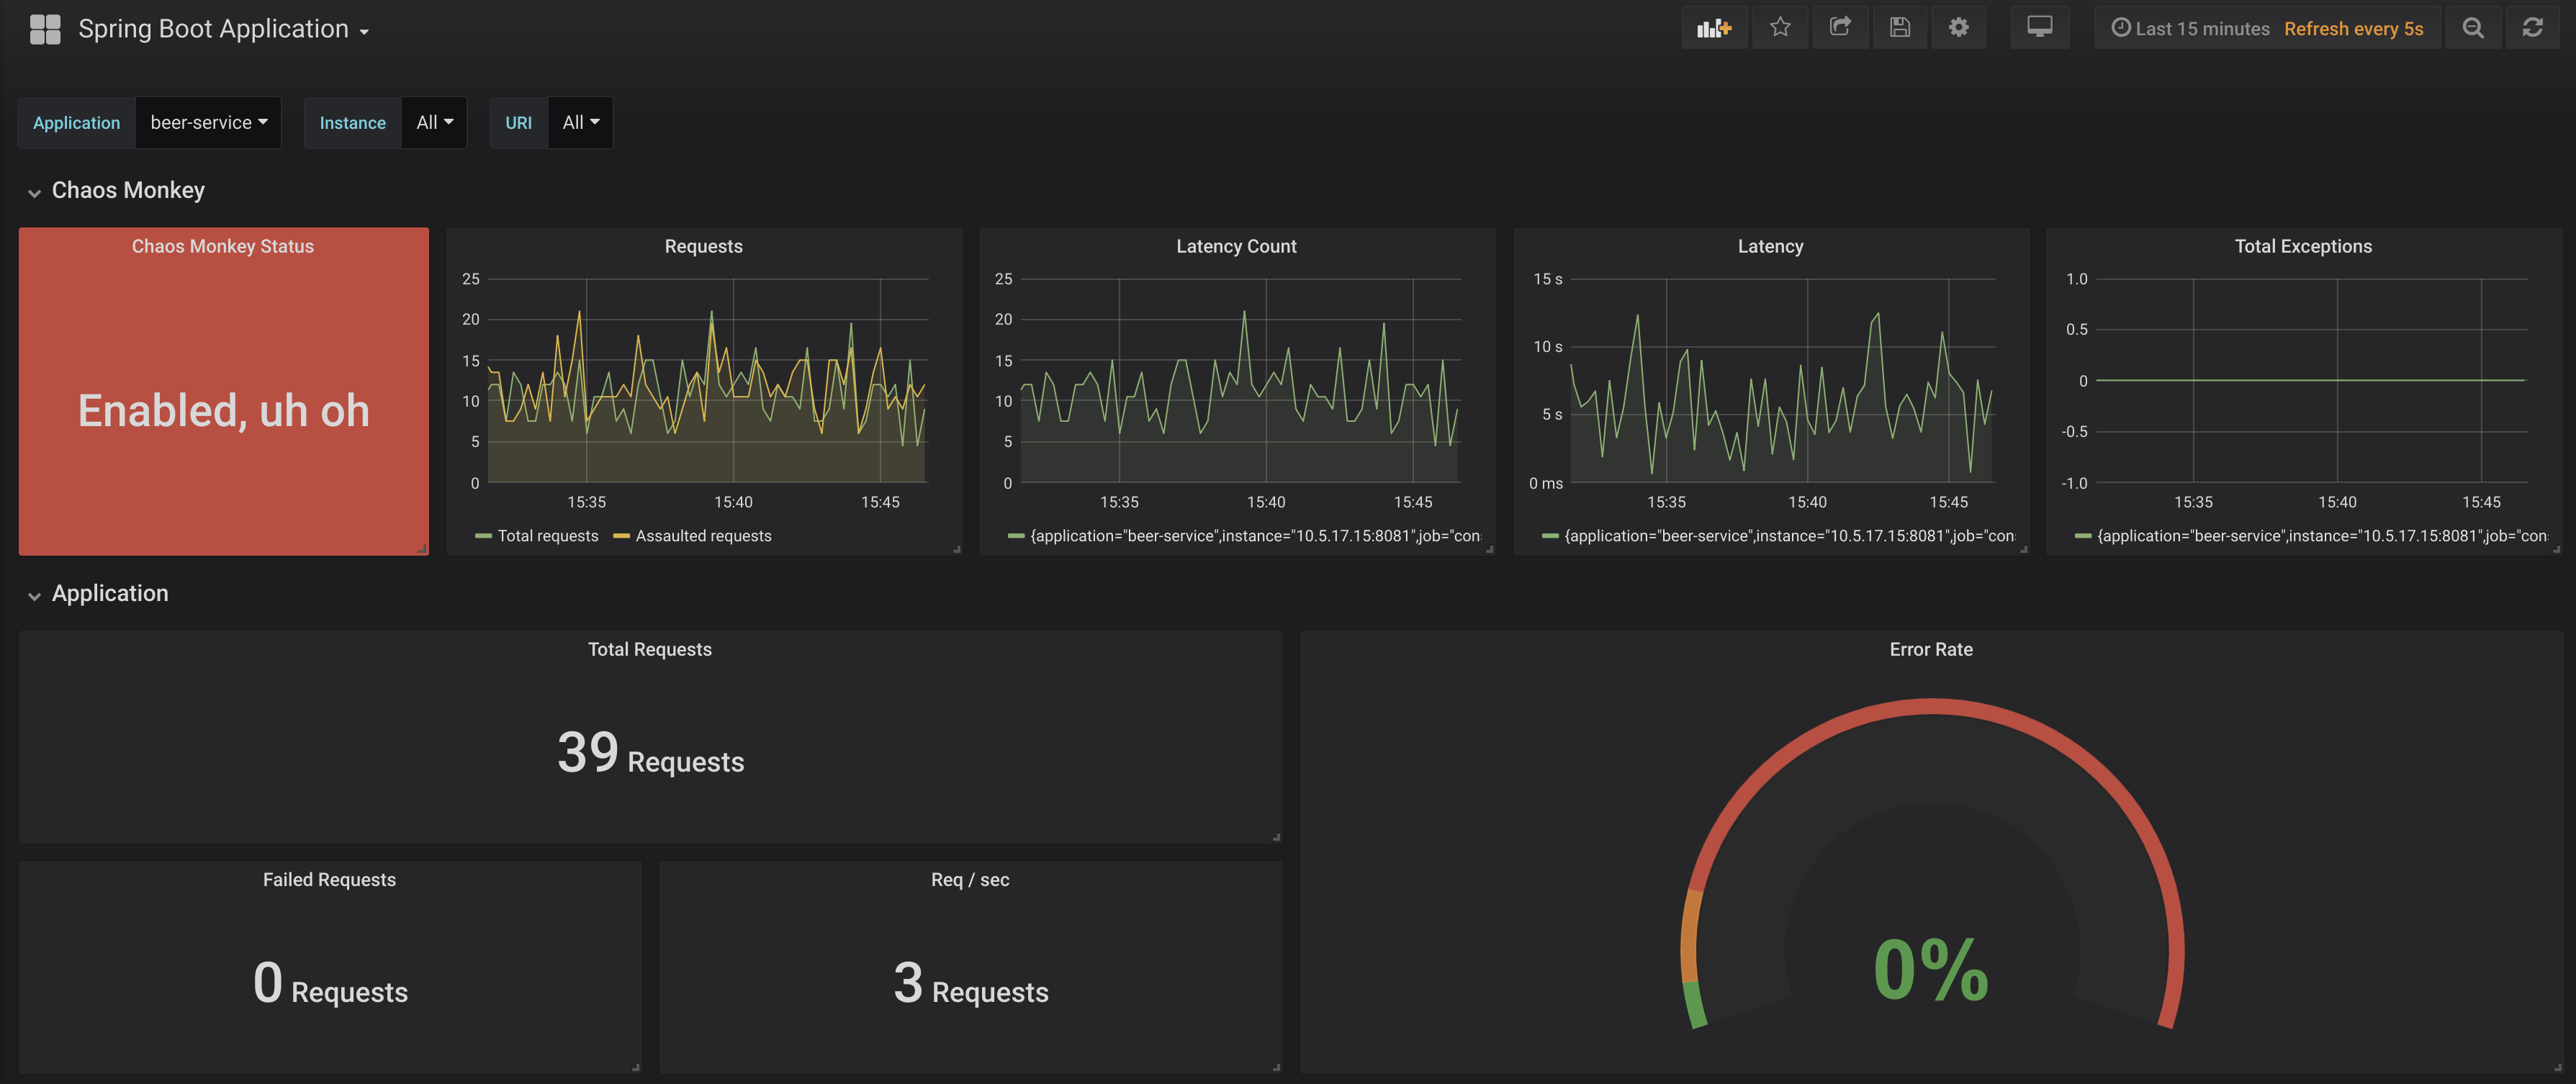
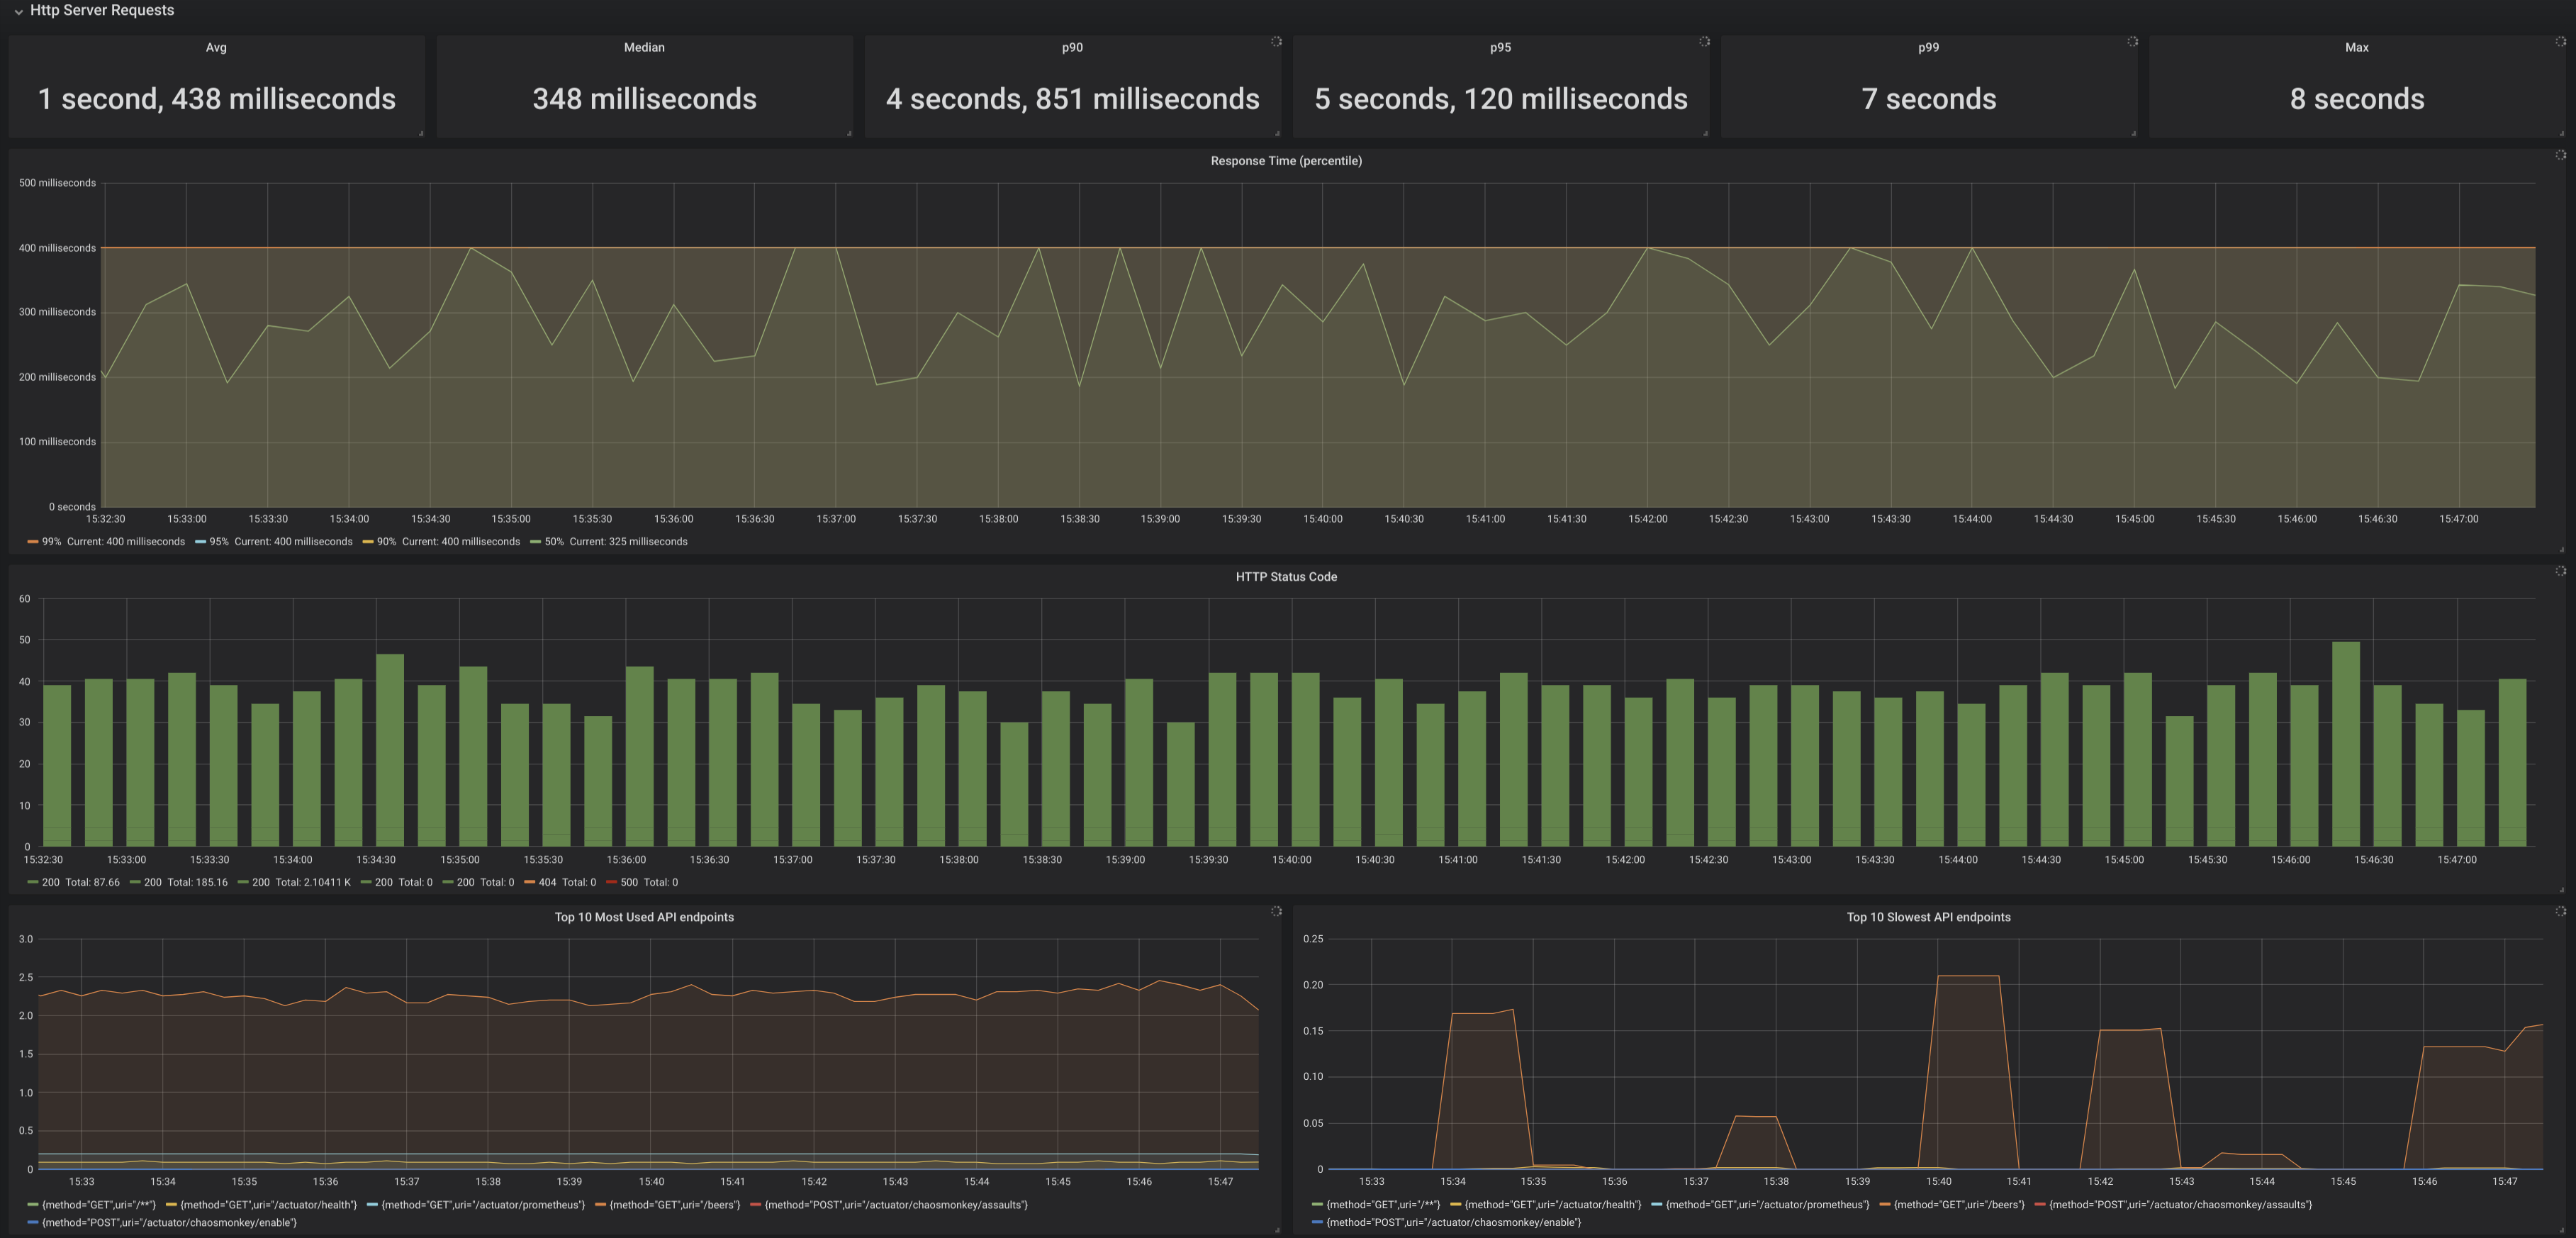
Can visualise metrics from your Spring Boot application such as Controllers, most used & slowest endpoints, sessions, and even Chaos Monkey experiments if enabled.
Application properties example: management: metrics: tags: application: ${spring.application.name} distribution: percentiles: http.server.requests: 0.5, 0.9, 0.95, 0.99 sla: http.server.requests: 100ms, 200ms, 400ms, 1s, 5s
Data source config
Collector config:
Upload an updated version of an exported dashboard.json file from Grafana
| Revision | Description | Created | |
|---|---|---|---|
| Download |
Spring Boot
Easily monitor Spring Boot with Grafana Cloud's out-of-the-box monitoring solution.
Learn more

