
Kubernetes Pods/Containers Resources
Display usage of resources by pod or container in kubernetes cluster.
Dashboard for k8s clusters that use kube-prometheus for collecting metrics.
About Dashboard
This dashboard will help you visualize resource utilization per pod or container.
Graph panels
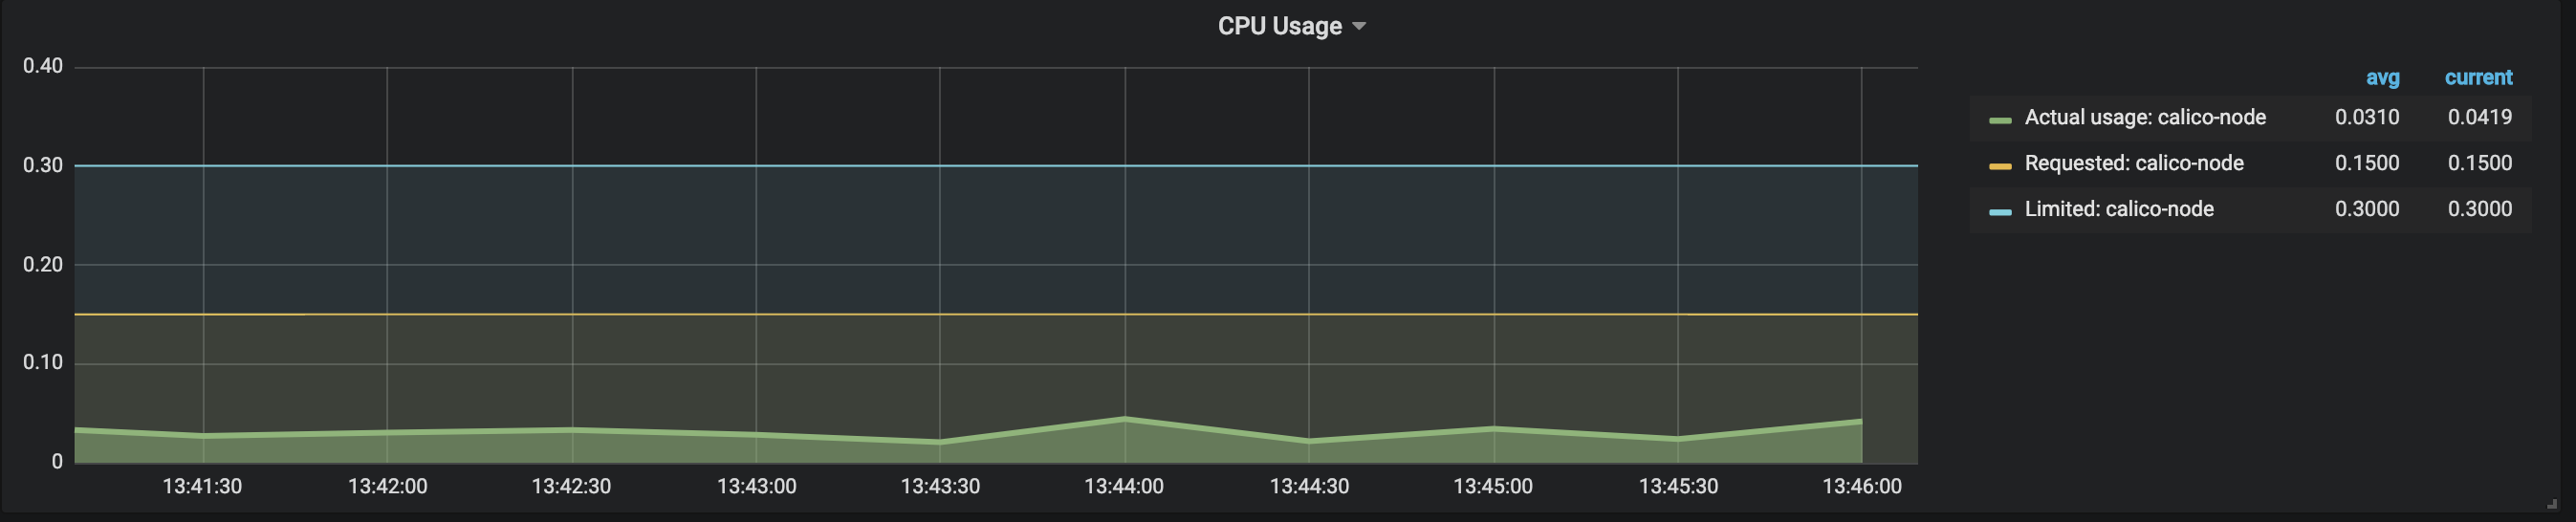
CPU
- Actual usage
- Requested
- Limited
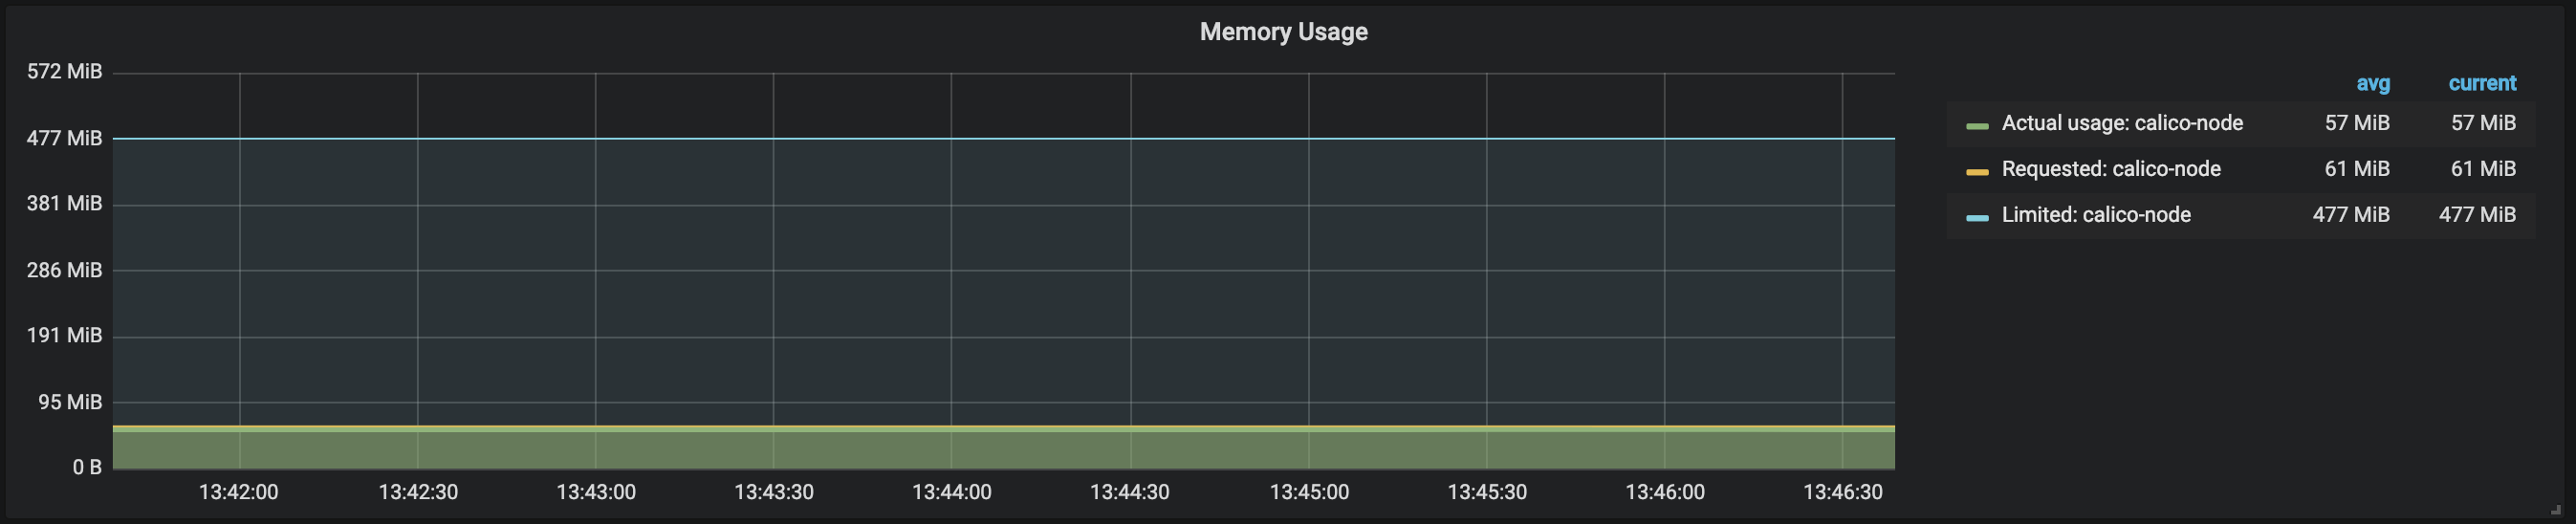
RAM
- Actual usage
- Requested
- Limited
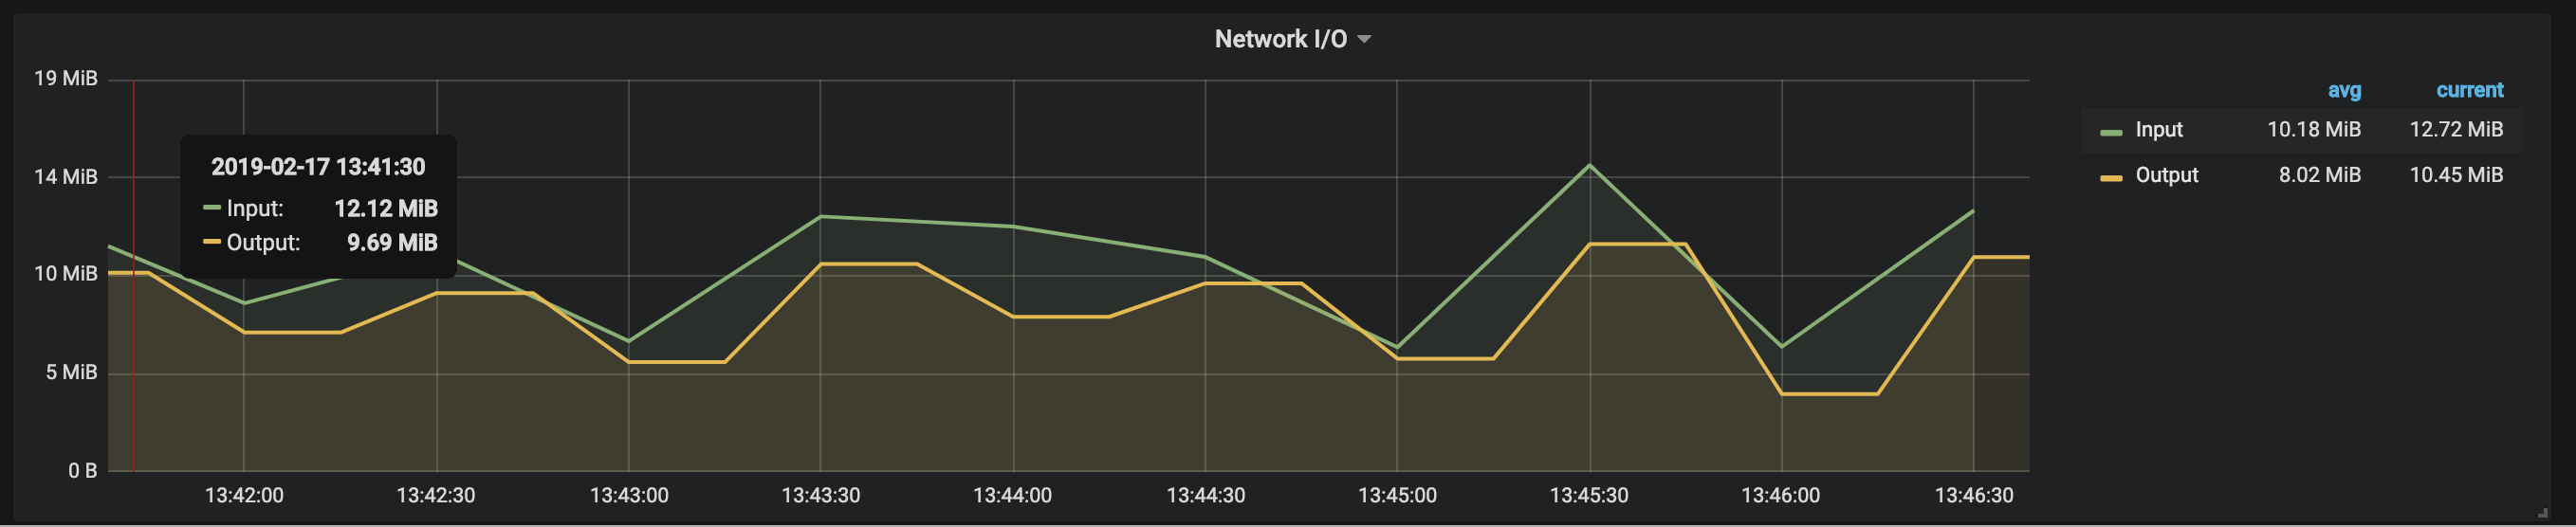
Network
- Input
- Output
How to use
After importing dashboard - create variable $source that will contain the datasource (if you are using different datasources for different cluster), or just hardcode it.
How to contribute
Feel free to make PR in github repository.
Other k8s resources dashboards
Data source config
Collector type:
Collector plugins:
Collector config:
Revisions
Upload an updated version of an exported dashboard.json file from Grafana
| Revision | Description | Created | |
|---|---|---|---|
| Download |
Kubernetes
Monitor your Kubernetes deployment with prebuilt visualizations that allow you to drill down from a high-level cluster overview to pod-specific details in minutes.
Learn more