
Dashboard Mysql Zabbix
Example dashboard of database Myssql
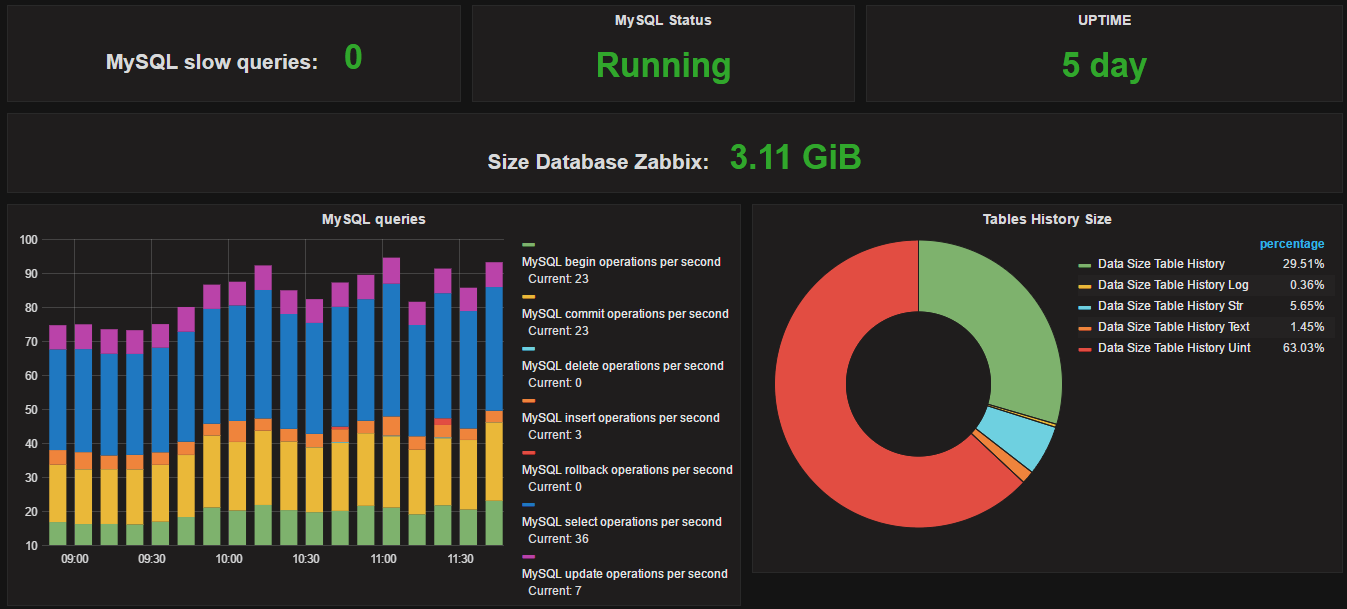
- Uptime Mysql.
- Mysql Status.
- Monitoring queries operation per seconds.
- Slow queries.
- Size database Zabbix.
- Size Tables History .
contact: andreantunes.si@gmail.com
Data source config
Collector type:
Collector plugins:
Collector config:
Revisions
Upload an updated version of an exported dashboard.json file from Grafana
| Revision | Description | Created | |
|---|---|---|---|
| Download |
MySQL
Monitor MySQL with Grafana. Easily monitor your MySQL deployment with Grafana Cloud's out-of-the-box monitoring solution.
Learn more