
JVM Metrics

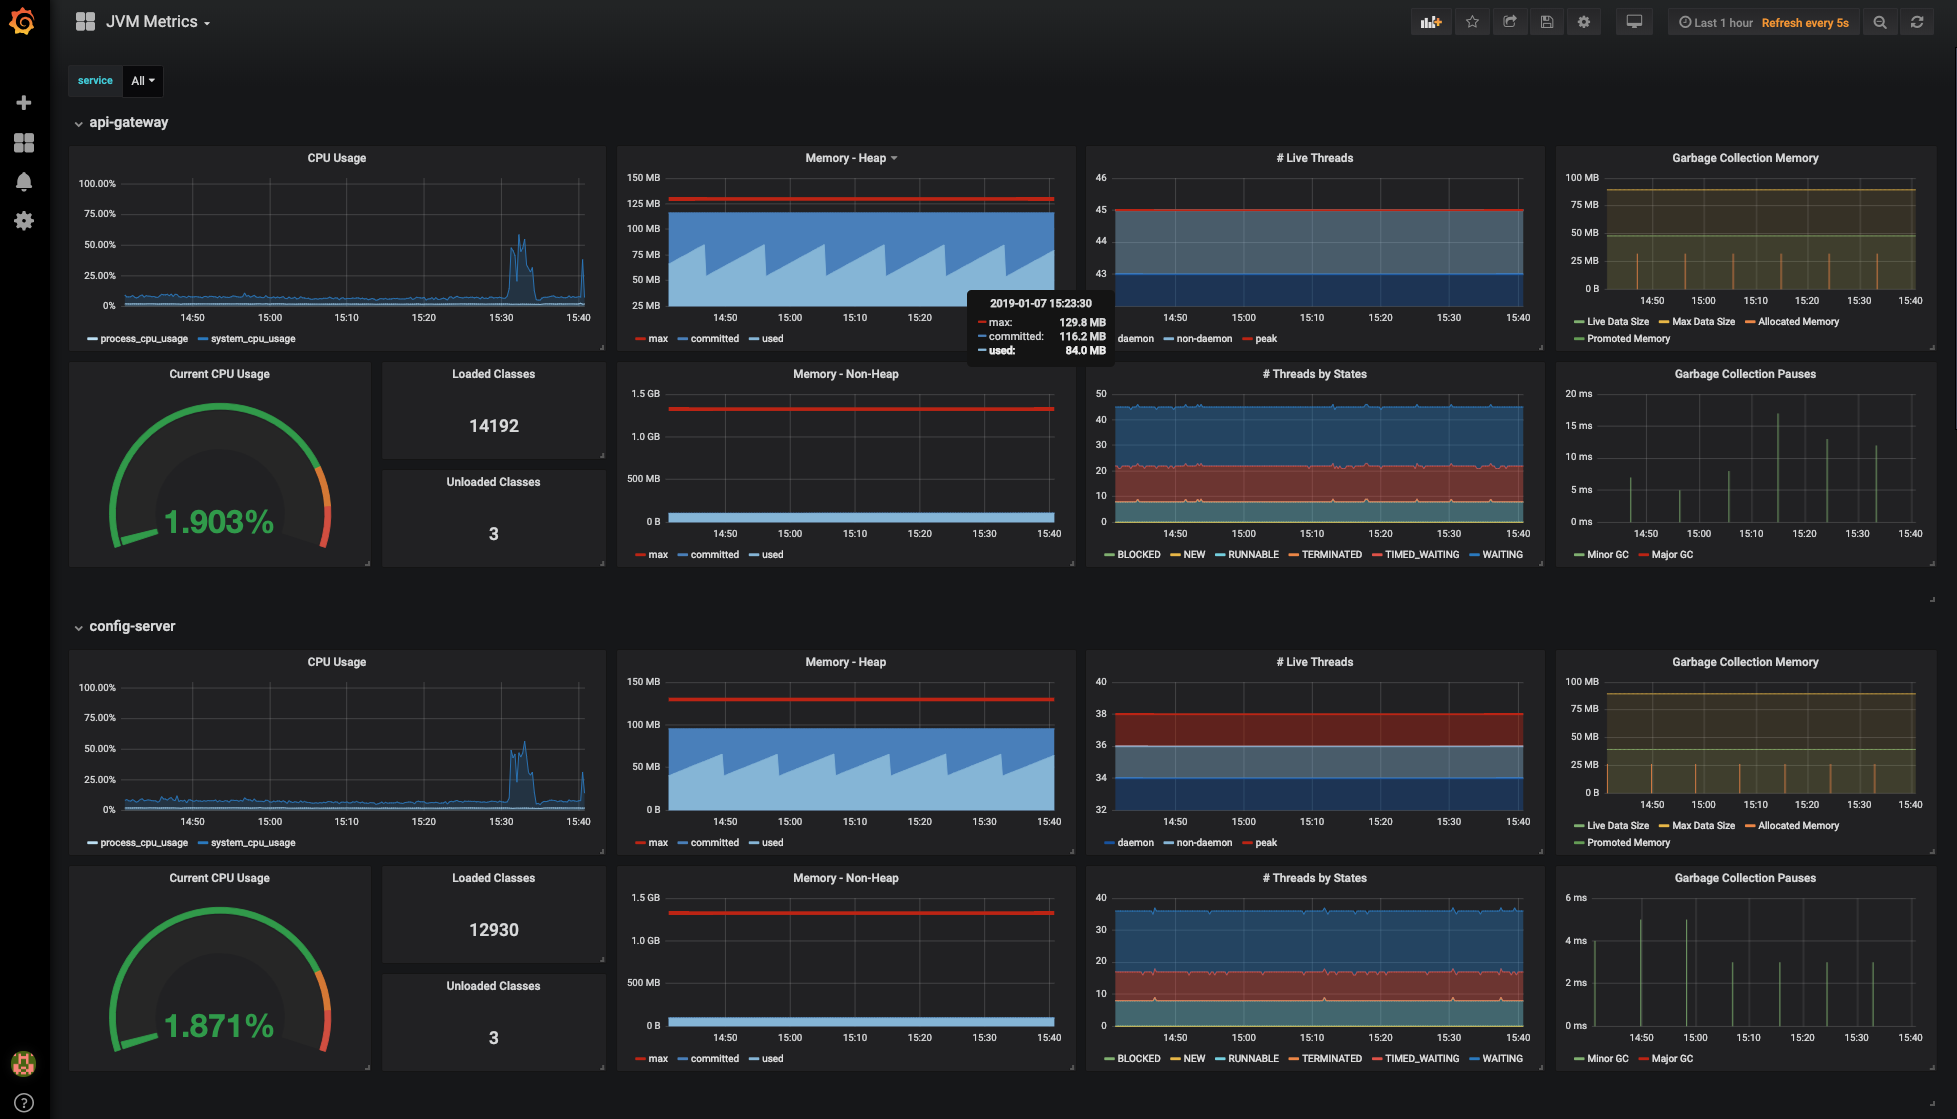
Shows JVM metrics collected by inspectIT OpenCensus Edition:
- JVM CPU metrics
- JVM memory metrics
- JVM garbage collection metrics
This dashboard is for usage with a Prometheus data source.
Data source config
Collector type:
Collector plugins:
Collector config:
Revisions
Upload an updated version of an exported dashboard.json file from Grafana
| Revision | Description | Created | |
|---|---|---|---|
| Download |
Java Virtual Machine (JVM)
Easily monitor a Java virtual machine, which allows computers to run Java programs, with Grafana Cloud's out-of-the-box monitoring solution.
Learn more