Ceph - Cluster
Ceph Cluster overview.
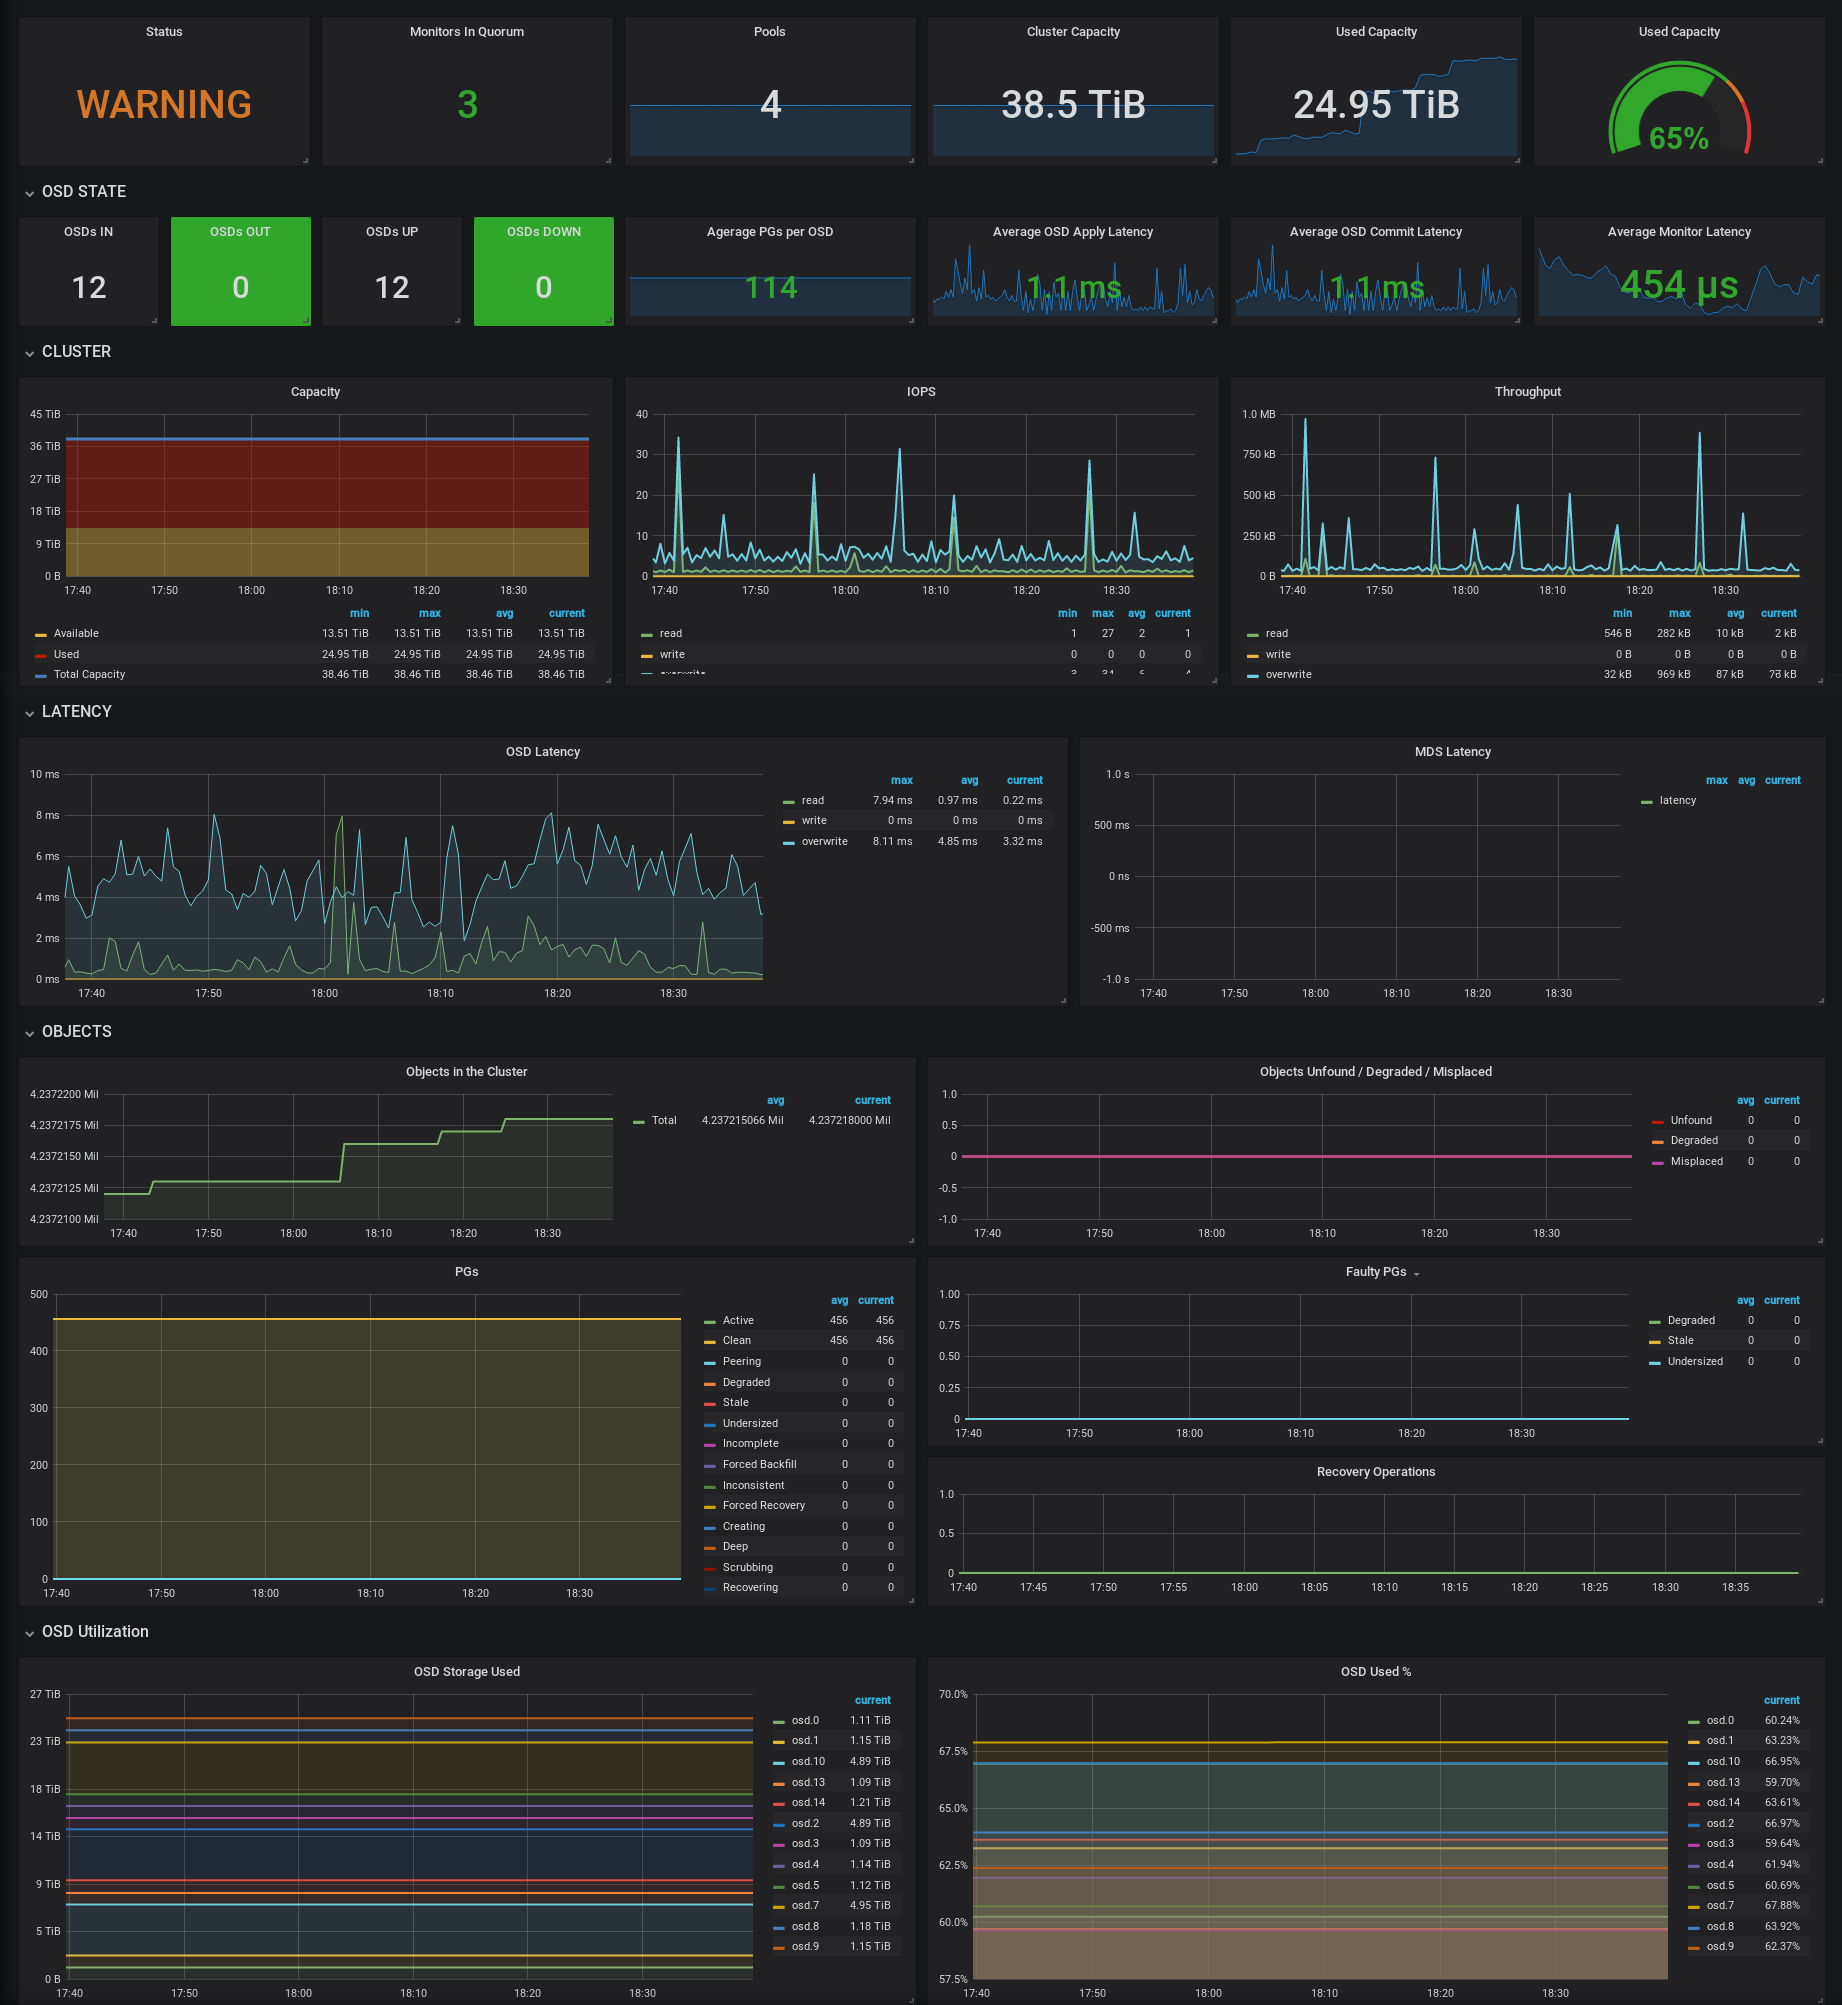
Ceph Cluster overview, built for ceph-mgr's built-in prometheus exporter (available since 13.2 Mimic) with multi-cluster support (cluster is selected via $job).
Shows the following:
- Cluster state
- Monitors in quorum
- Number of pools
- Cluster capacity: used and total
- OSDs IN/OUT/UP/DOWN
- Average PGs per OSD
- Average OSD apply/commit latency (equal in Bluestore)
- Average monitor consensus refresh latency
- Latency, IOPS and Throughput for Read, Write, Read-Modify-Write operations
- MDS latency
- Objects in the cluster: total
- Objects in the cluster: unfound/degraded/misplaced
- PGs by status
- OSD storage used (total)
- OSD storage used (%)
Data source config
Collector config:
Upload an updated version of an exported dashboard.json file from Grafana
| Revision | Description | Created | |
|---|---|---|---|
| Download |
Ceph
Monitor Ceph with Grafana. Easily keep tabs on your cluster with Grafana Cloud's out-of-the-box monitoring solution.
Learn more
