
Kubernetes cluster monitoring (via Prometheus)
https://grafana.com/dashboards/3119 - Monitors Kubernetes cluster using Prometheus. Shows overall cluster CPU / Memory / Filesystem usage as well as individual pod, containers, control plane (as deployed by kops) statistics. Uses cAdvisor metrics only. Tweaked from original https://grafana.com/dashboards/315 to add templating for: - adaptable $interval (instead of hardcoded 1m) - selectable ${DS_PROMETHEUS} (very useful to have a single dashboard tackling several prometheis )
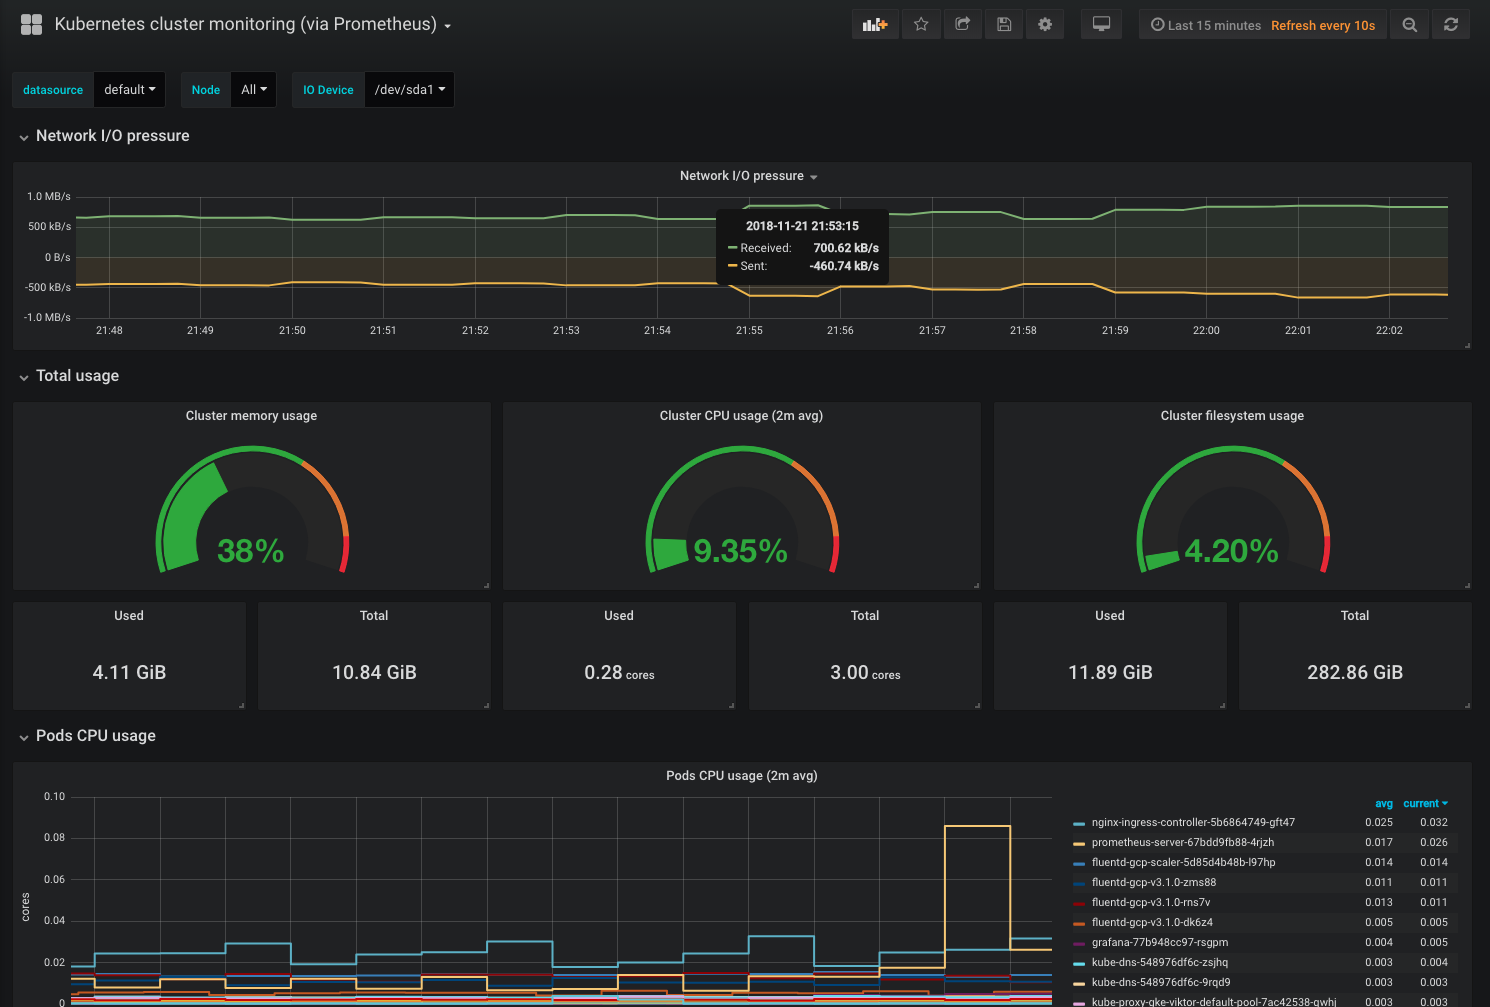
The Kubernetes cluster monitoring (via Prometheus) dashboard uses the data source to create a Grafana dashboard with the graph and singlestat panels.
Data source config
Collector type:
Collector plugins:
Collector config:
Revisions
Upload an updated version of an exported dashboard.json file from Grafana
| Revision | Description | Created | |
|---|---|---|---|
| Download |
Kubernetes
Monitor your Kubernetes deployment with prebuilt visualizations that allow you to drill down from a high-level cluster overview to pod-specific details in minutes.
Learn more