
System Monitoring
This Grafana Dashboard helps to monitor OS level Statistics.
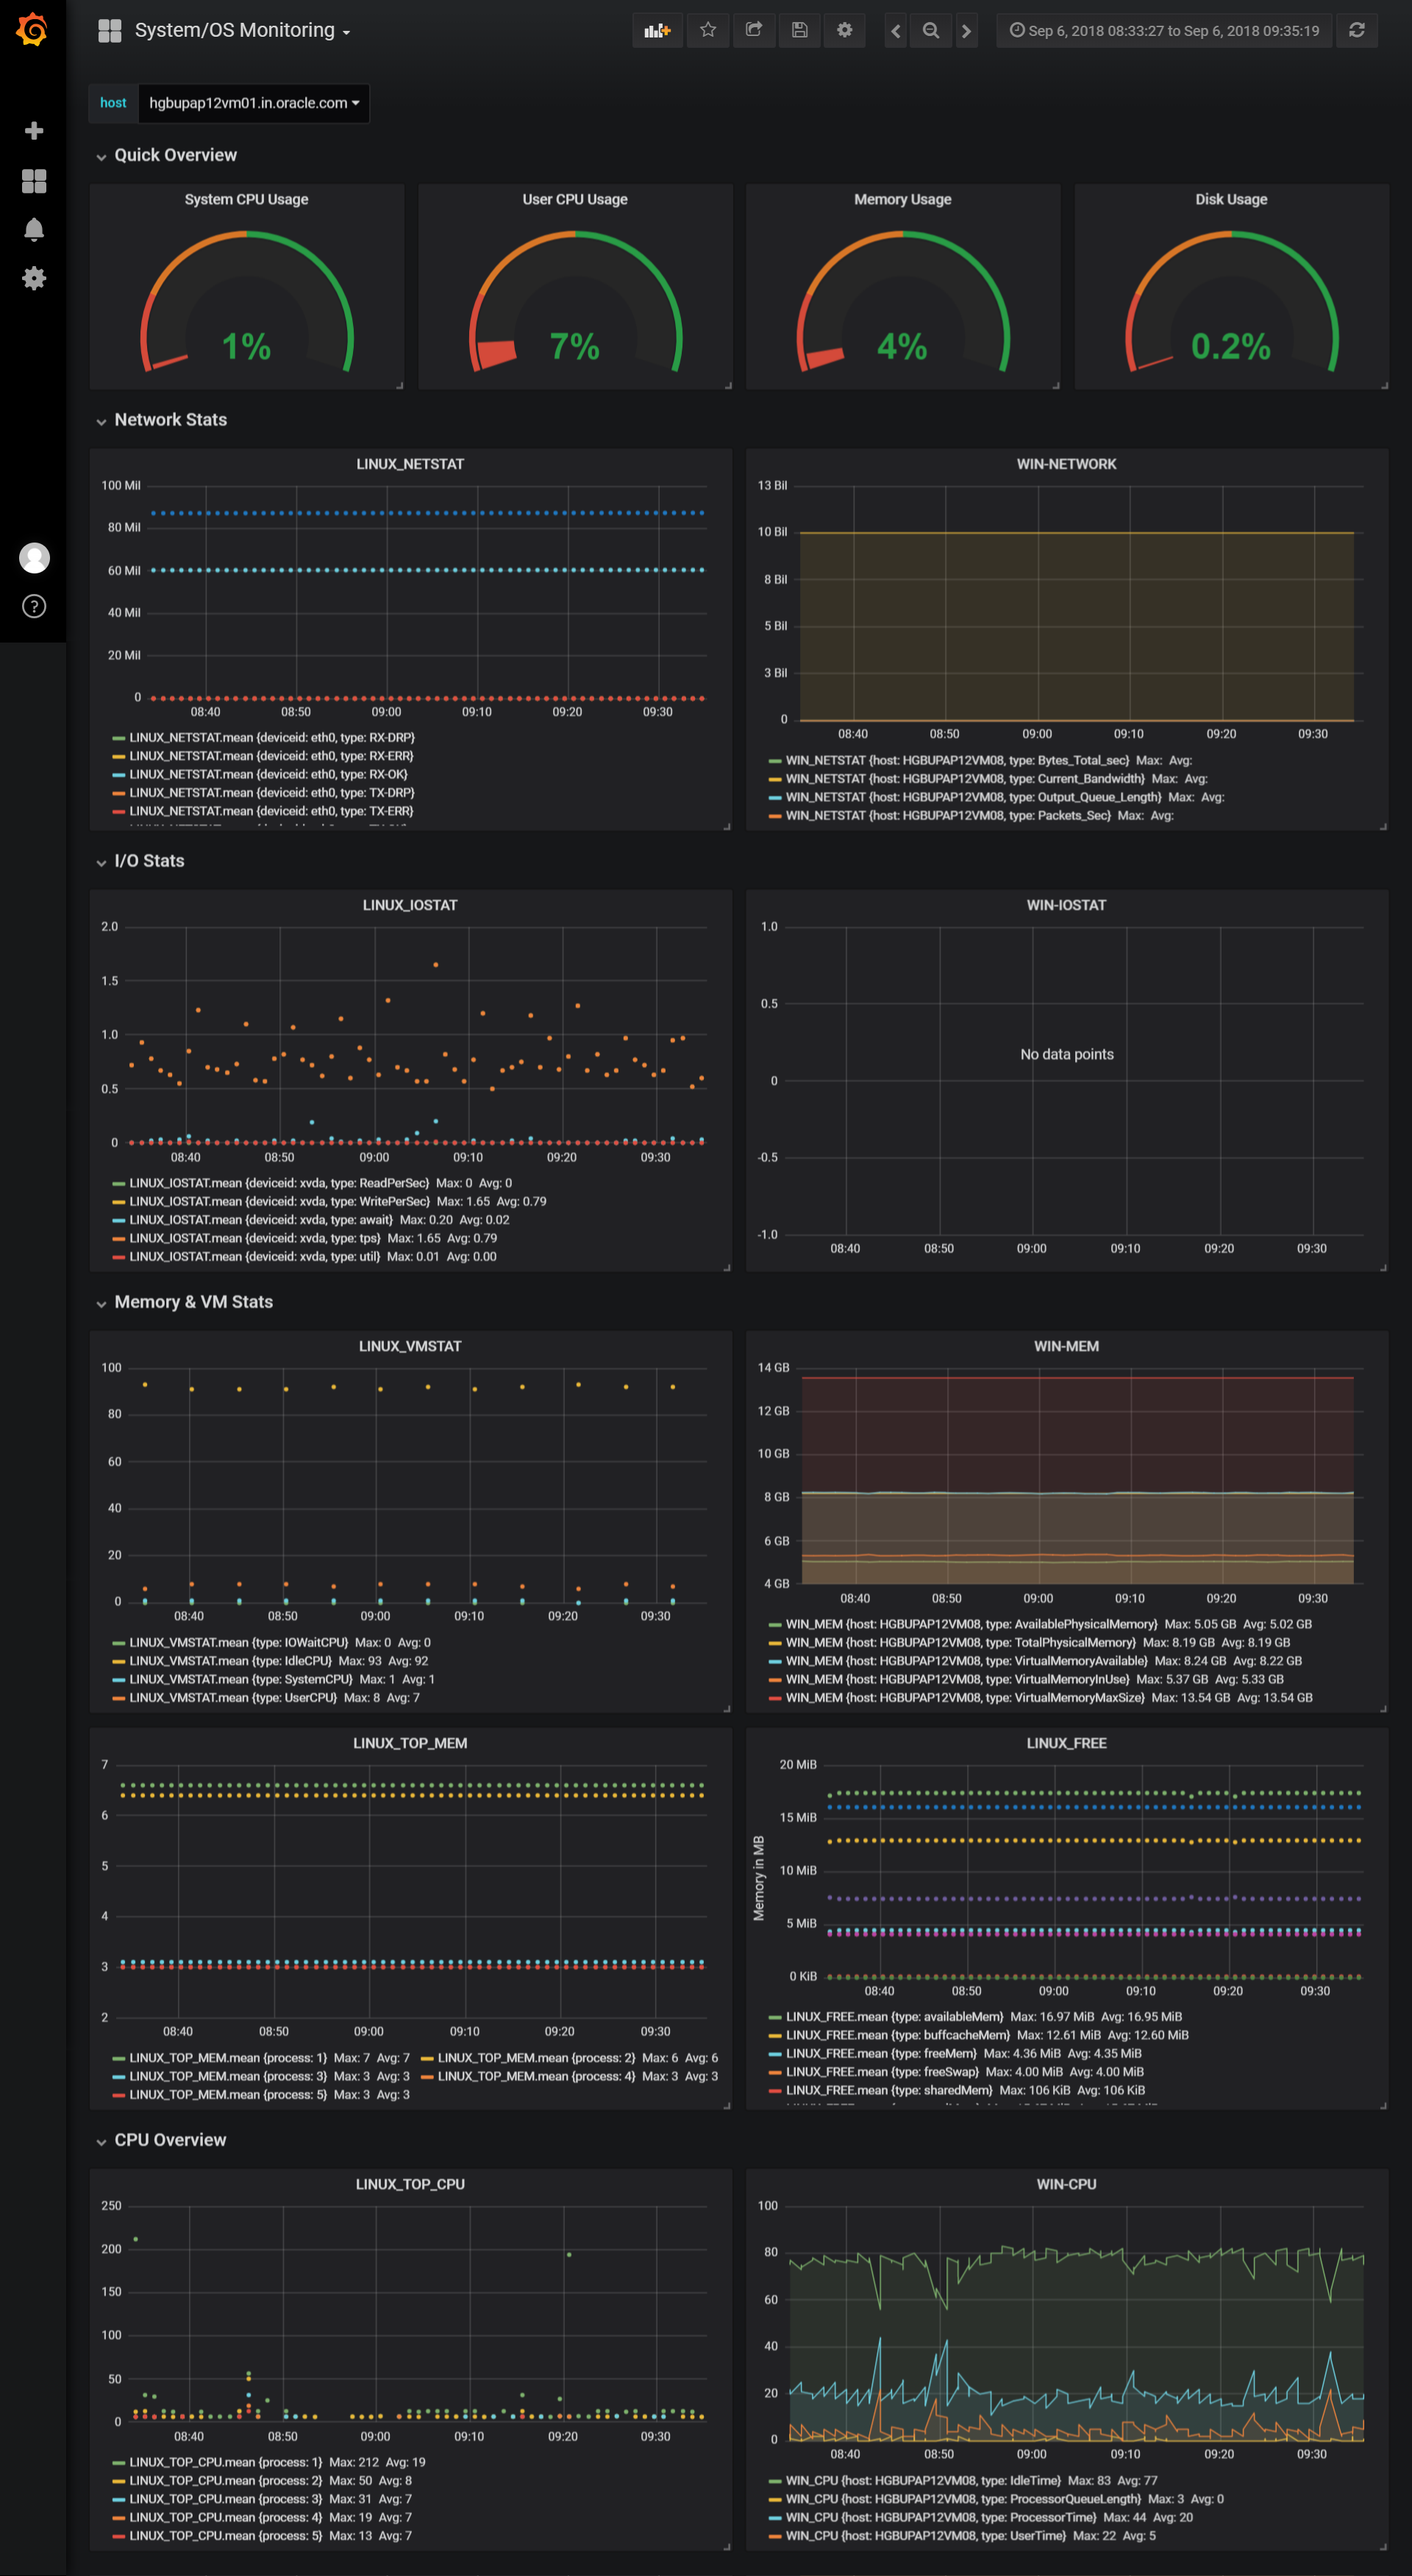
This Dashboard displays all the Linux & Windows Operating System Statistics Like IOSTAT, NETWORK Stat, Memory Usage, CPU Load, Disk Usage etc.
Data source config
Collector type:
Collector plugins:
Collector config:
Revisions
Upload an updated version of an exported dashboard.json file from Grafana
| Revision | Description | Created | |
|---|---|---|---|
| Download |