GLPI Dashboard (Tickets)
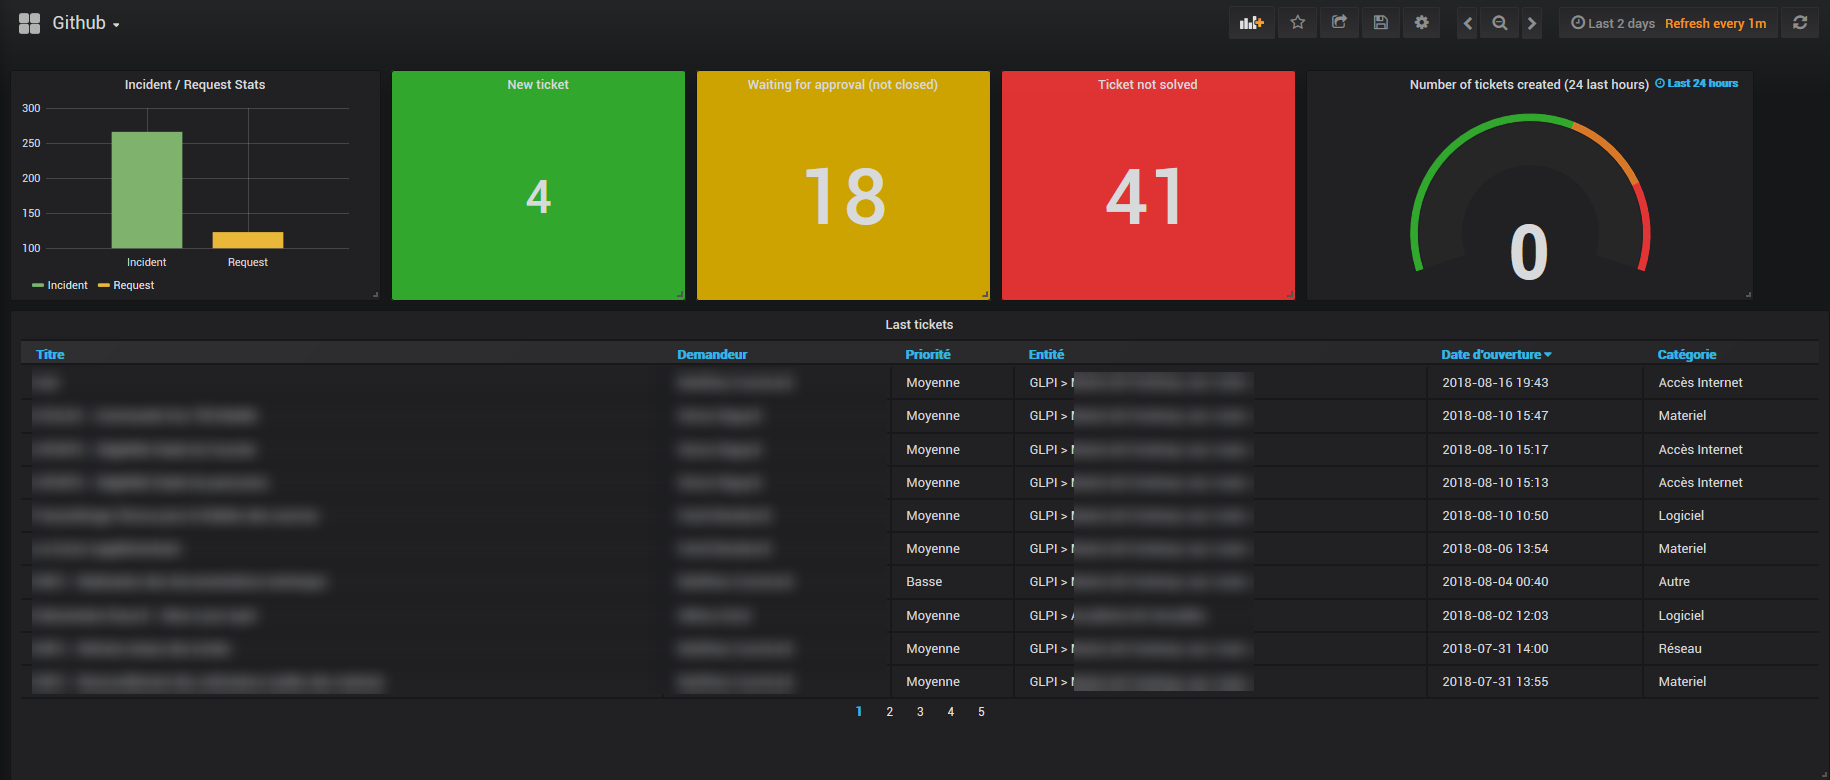
GLPI Dashboard Show somes informations on tickets
Informations
This dashboard is based on the original from the GLPI Plugin, he's provide you clears statistics about your tickets from GLPI.
Setup
Your URL need to have the / at the end like :http://my-glpi-server.com/ and not http://my-glpi-server.com
Changelogs
v0.1
Import
- Added the choice of the datasource ($DS_GLPI) during the import
- Added a field for the GLPI url ($URL_GLPI) when importing
Dashboard
- Histogram of Incidents / Request
- SingleStat with: New Ticket, Ticket waiting for validation, Ticket unresolved, number of tickets created with time range 24h
- Modification of the "Last Ticket" table that displayed the HTML tags in the column Applicant
Resume variables for creating different panels.
To improve
Retrieve the URL directly from the plugin configuration but removing the "apirest.php"
Data source config
Collector config:
Upload an updated version of an exported dashboard.json file from Grafana
| Revision | Description | Created | |
|---|---|---|---|
| Download |

