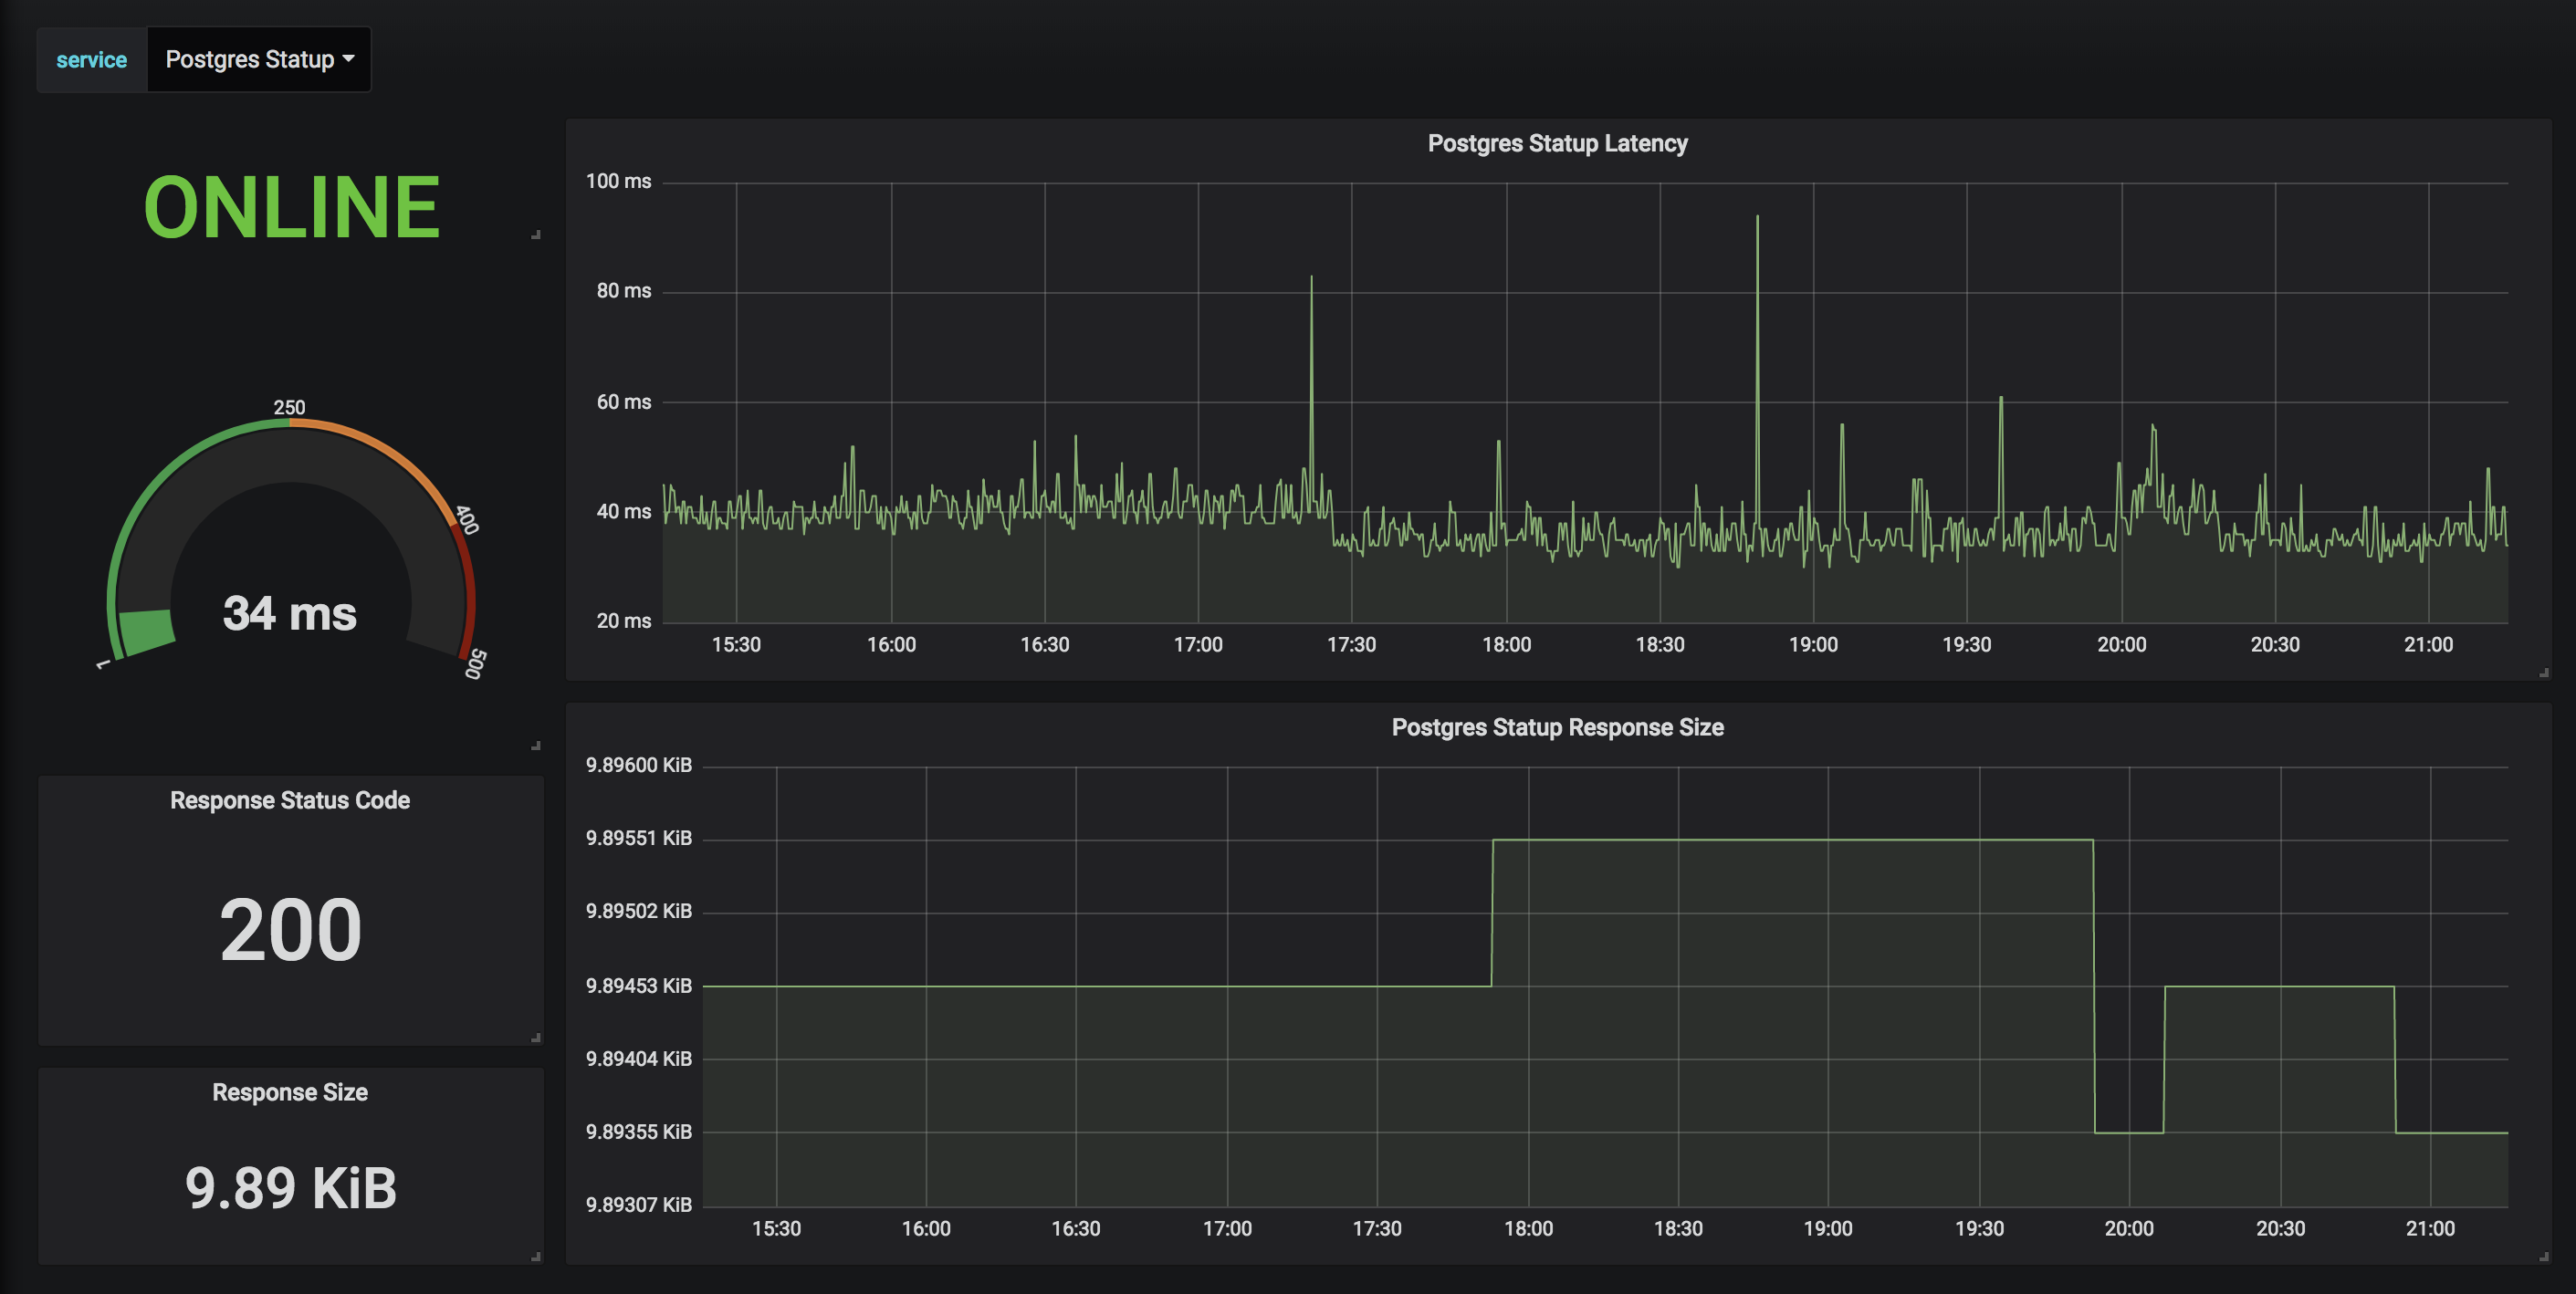
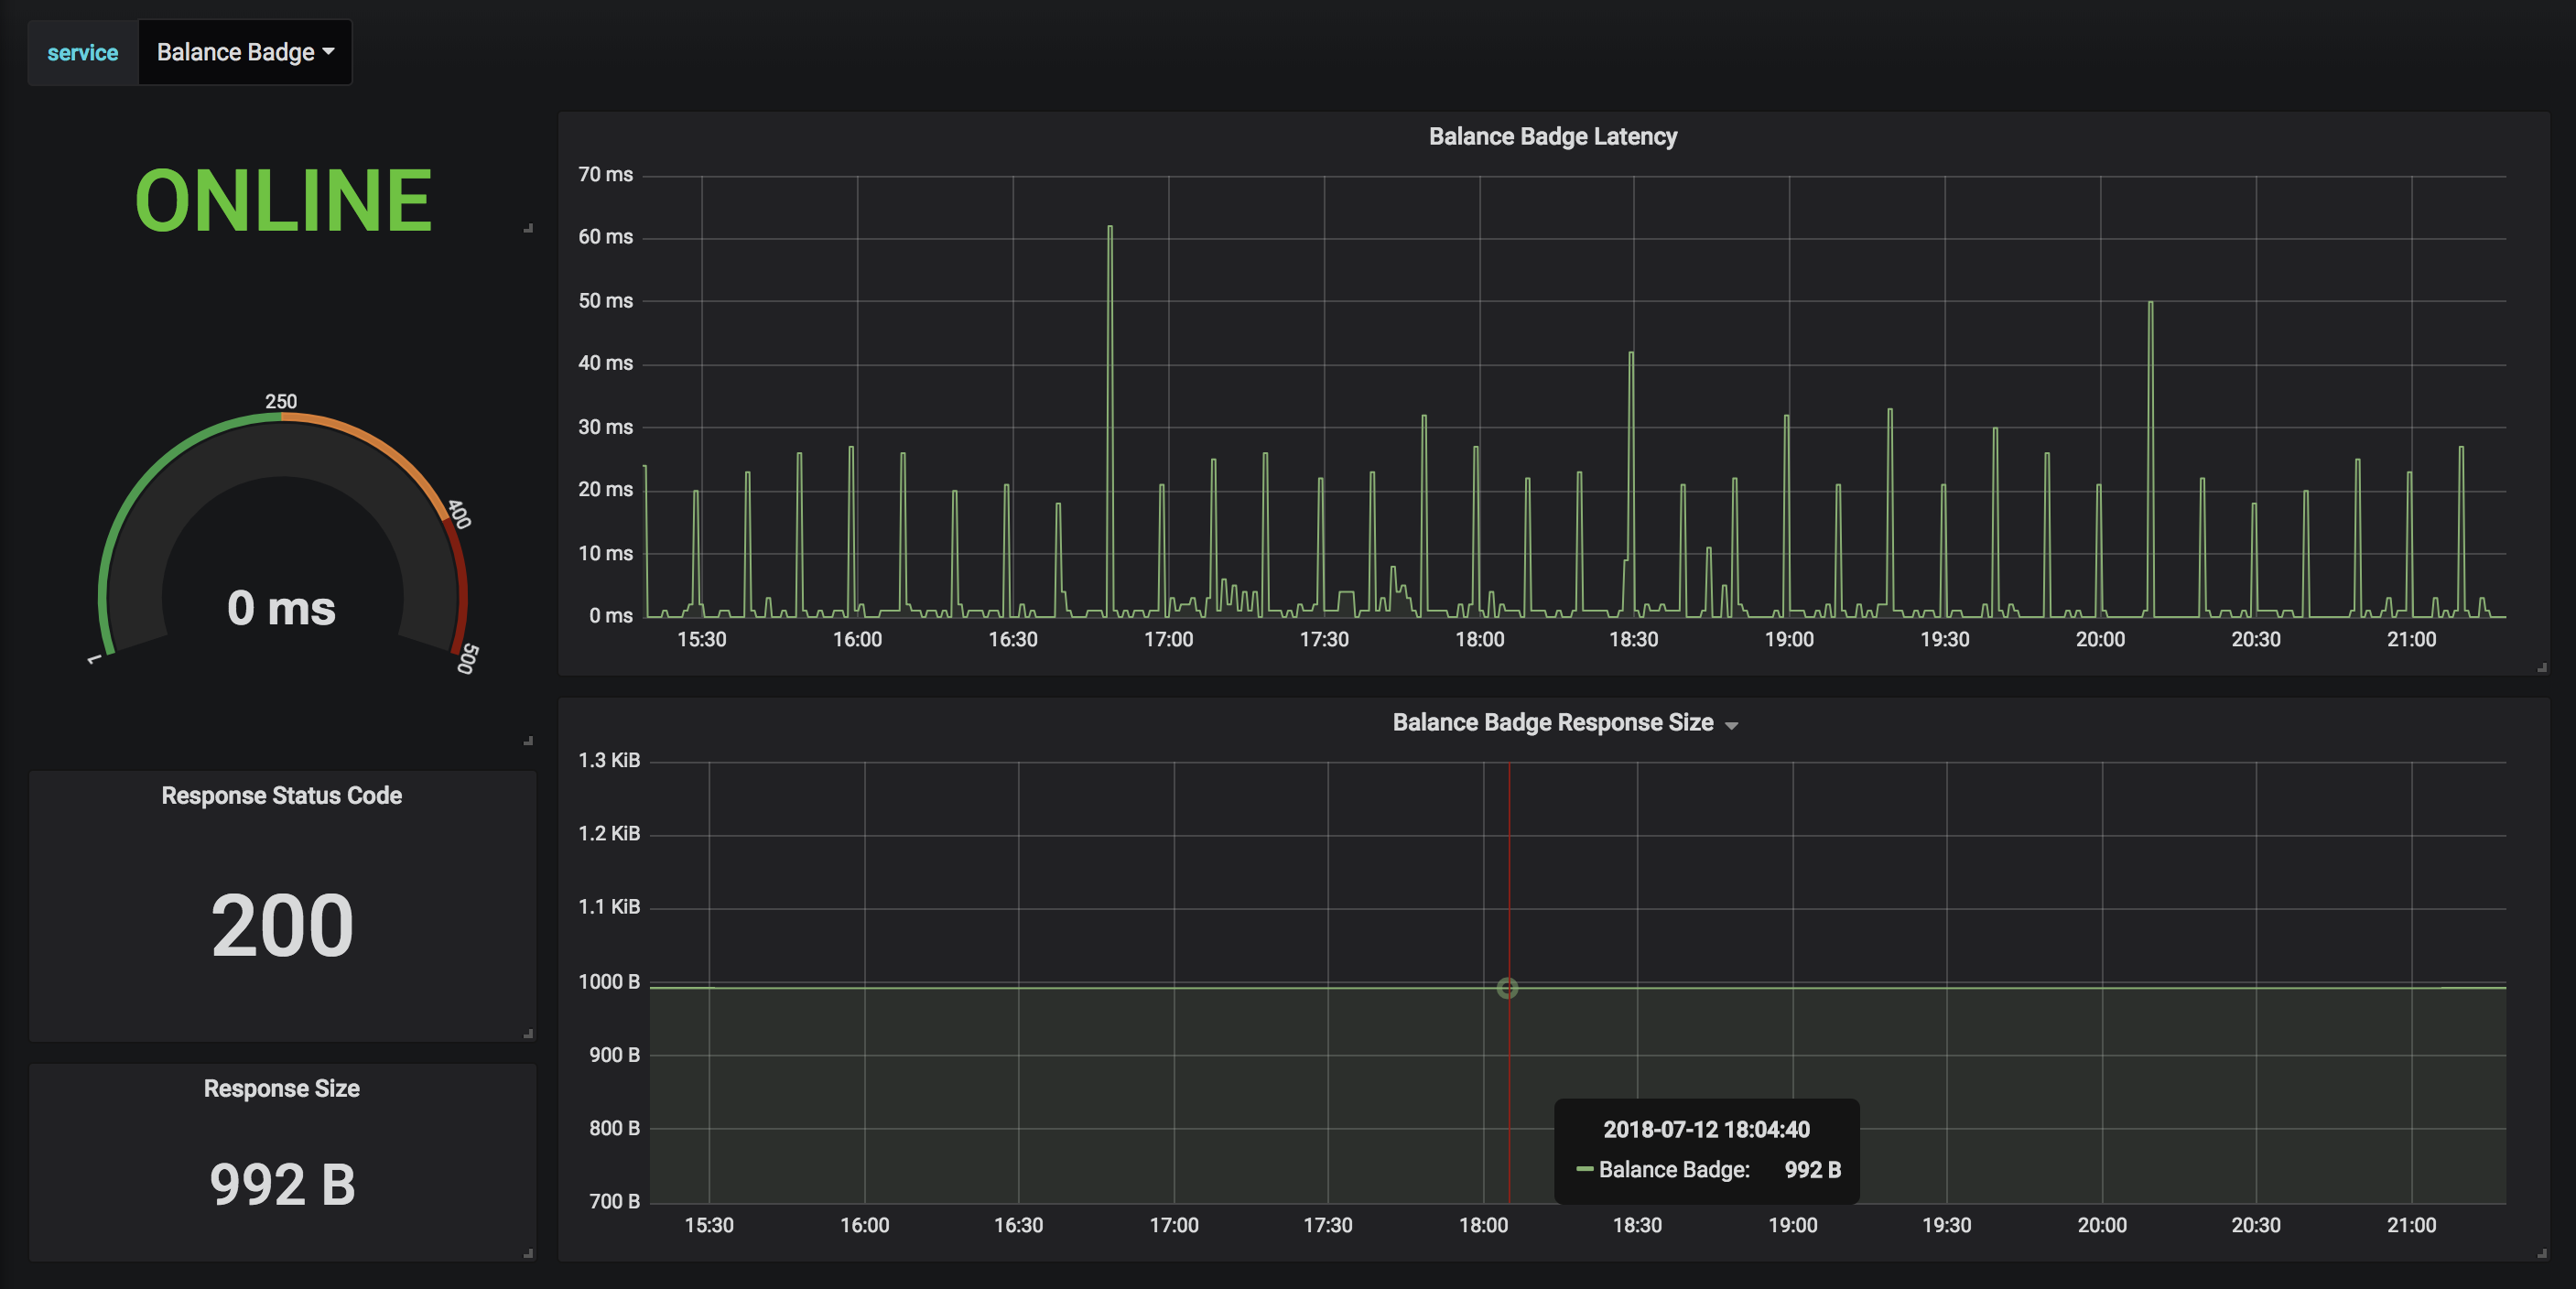
Statping on Grafana
Statping Grafana Dashboard
Statping Monitoring
You'll need to have a Statping Server to use this grafana dashboard. You can run Statping in a docker container for ease of use.
Statping includes a prometheus exporter so you can have even more monitoring power with your services. The prometheus exporter can be seen on /metrics, simply create another exporter in your prometheus config. Use your Statping API Secret for the Authorization Bearer header, the /metrics URL is dedicated for Prometheus and requires the correct API Secret has Authorization header.
Prometheus Exporter Example
scrape_configs:
  - job_name: 'statping'
    scrape_interval: 30s
    bearer_token: 'SECRET API KEY HERE'
    static_configs:
      - targets: ['statping:8080']
Data source config
Collector config:
Upload an updated version of an exported dashboard.json file from Grafana
| Revision | Description | Created | |
|---|---|---|---|
| Download |


