itl-icinga-influxdb
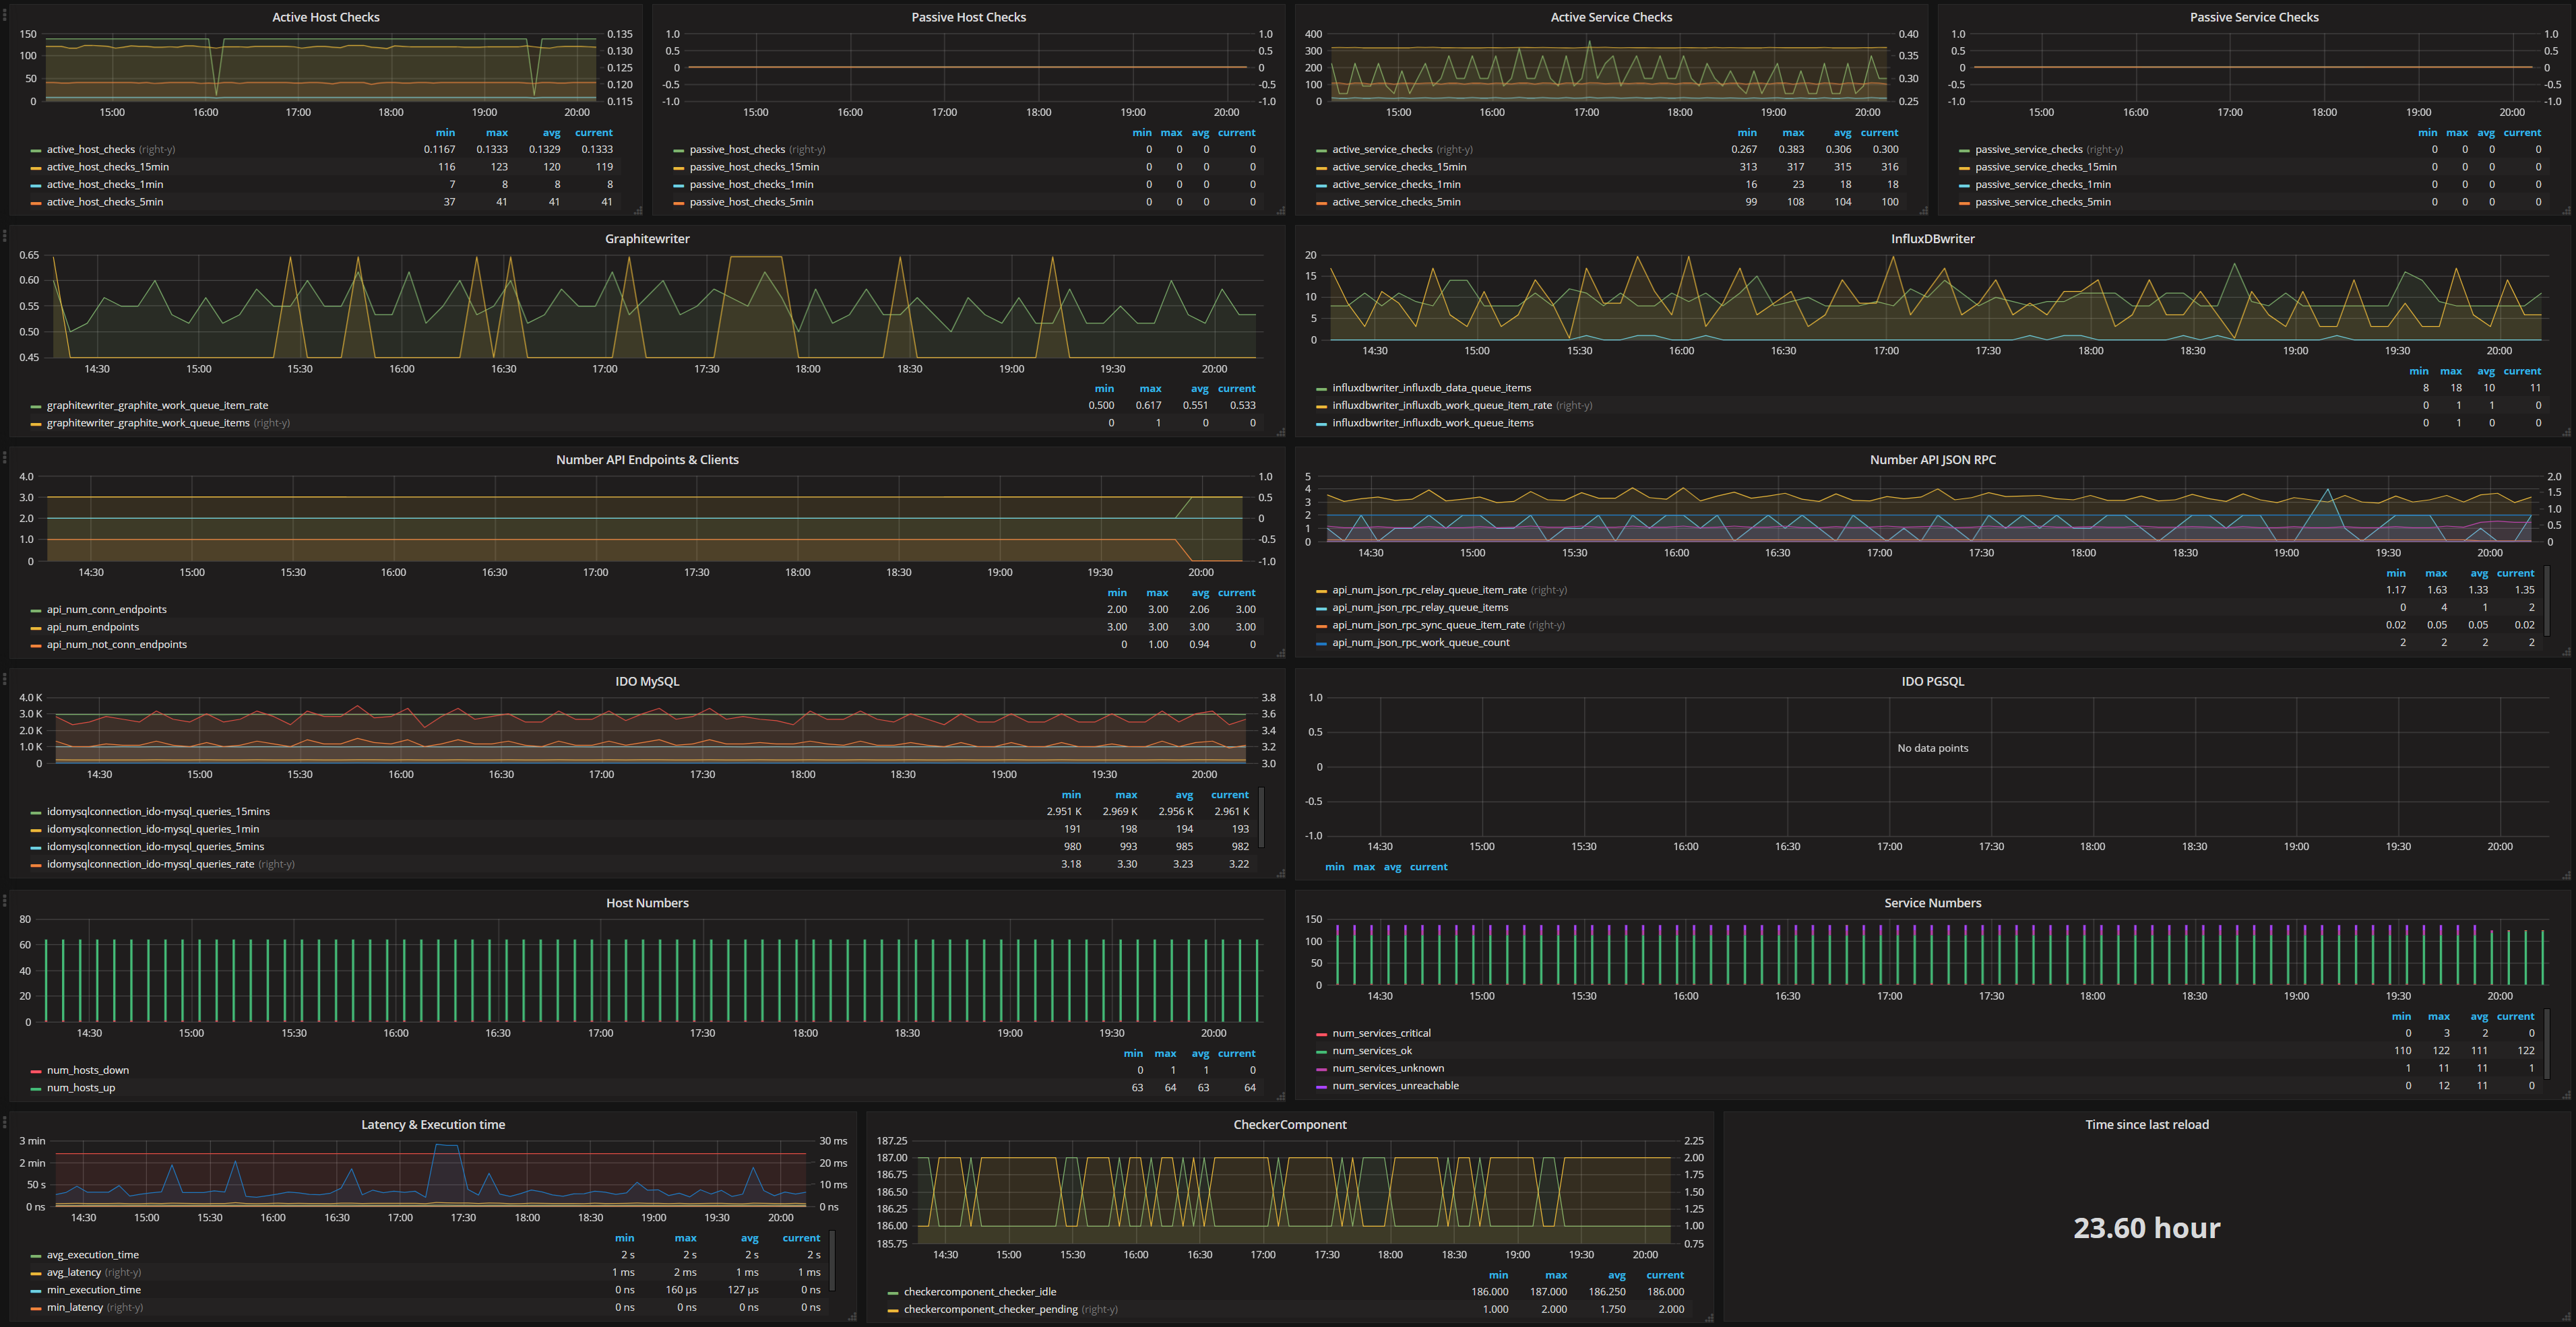
Dashboard for the internal command "icinga"
This dashboard is made to use with the Icingaweb2 module Grafana, but if you change the templating from constant to query you can also use it as a standalone dashboard.
Data source config
Collector config:
Upload an updated version of an exported dashboard.json file from Grafana
| Revision | Description | Created | |
|---|---|---|---|
| Download |
InfluxDB
Easily monitor InfluxDB, an open source time series database, with Grafana Cloud's out-of-the-box monitoring solution.
Learn more
