Windows Node
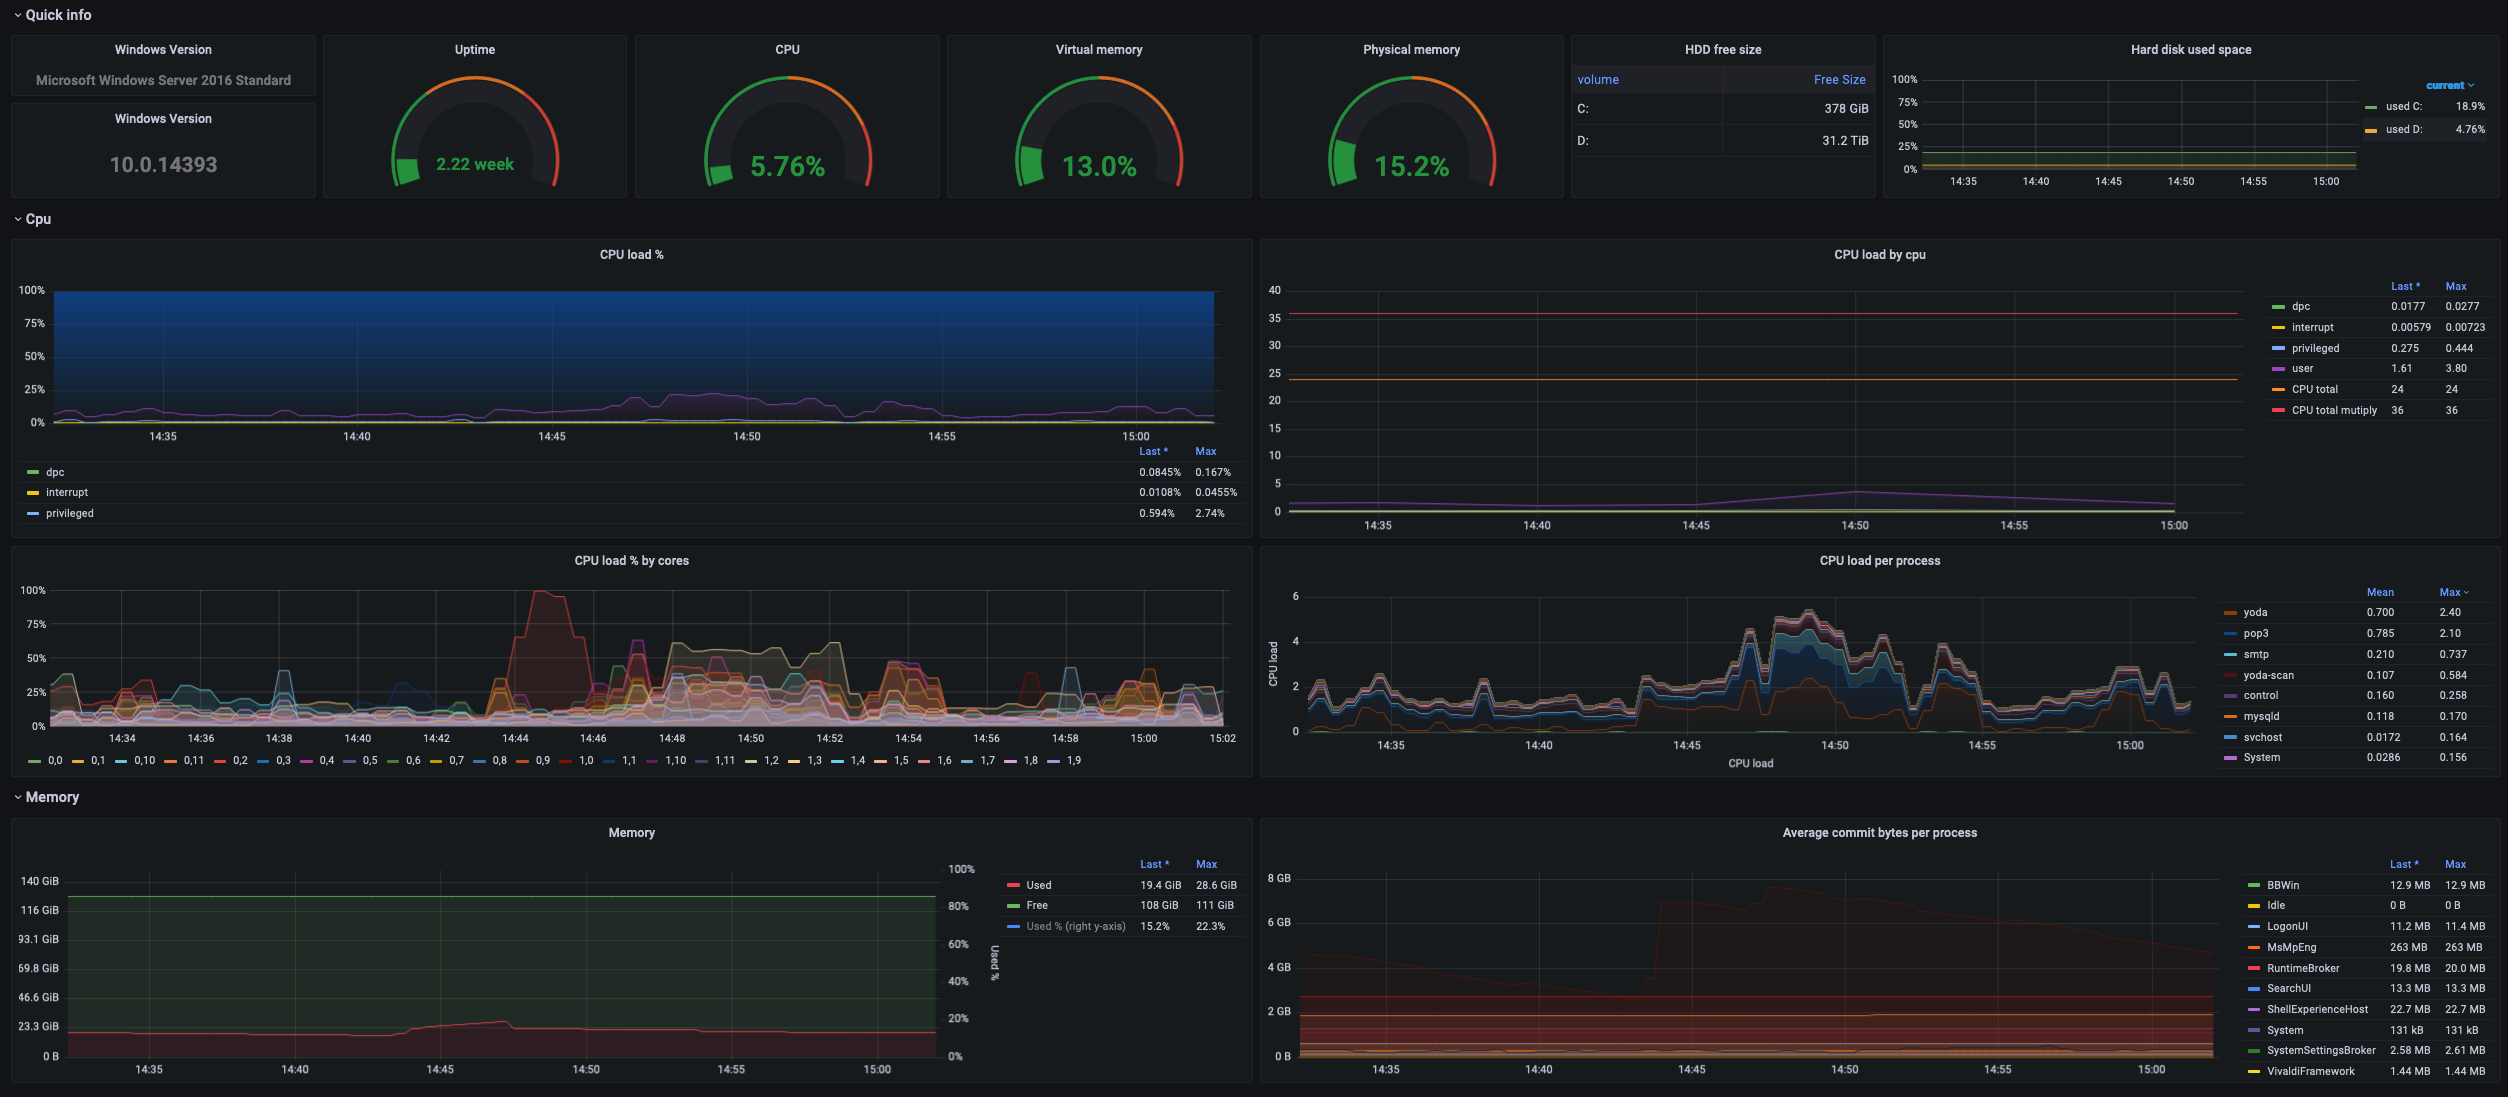
General stats dashboard with node selector, uses metrics from wmi_exporter
This is reworked Windows Node (credit to them), but for our use case it wasn't enought, I edit few things and add process info (not enabled by default in wmi_exporter!!!).
Update 9.2. 2022
- added new graph cpu per core
- added net graphs
- added disk graphs
- updated quick info
- removed $interval var and switched to $__rate_interval
Waiting for reintroduce negative-Y which should be in grafana 8.4, to convert rest of old graphs.
Hope you like it!
Data source config
Collector config:
Upload an updated version of an exported dashboard.json file from Grafana
| Revision | Description | Created | |
|---|---|---|---|
| Download |
Linux Server
Monitor Linux with Grafana. Easily monitor your Linux deployment with Grafana Cloud's out-of-the-box monitoring solution.
Learn more
