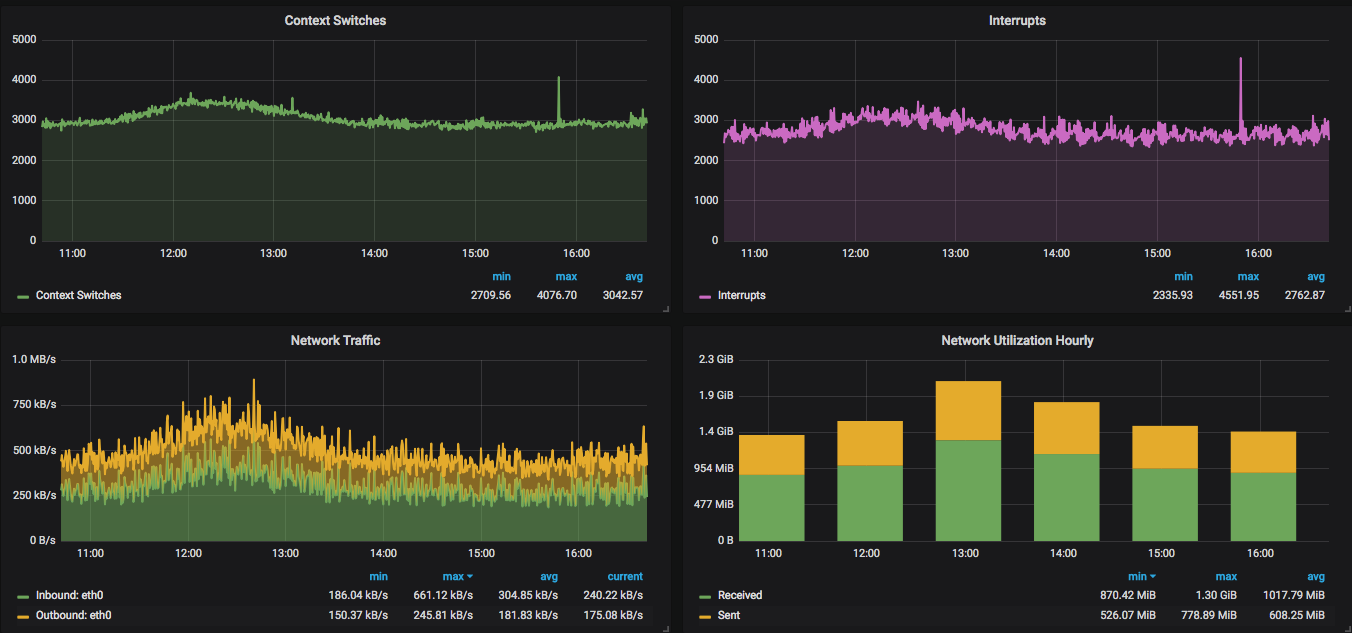
linux-node-exporter
Prometheus for system metrics. Load, CPU, RAM, network, process ...
You can add variables like dc(datacenter)/project/service_name.. from prometheus tag. If there is no variables, it is also valid using default instance variable.
Data source config
Collector config:
Upload an updated version of an exported dashboard.json file from Grafana
| Revision | Description | Created | |
|---|---|---|---|
| Download |
Linux Server
Monitor Linux with Grafana. Easily monitor your Linux deployment with Grafana Cloud's out-of-the-box monitoring solution.
Learn more
