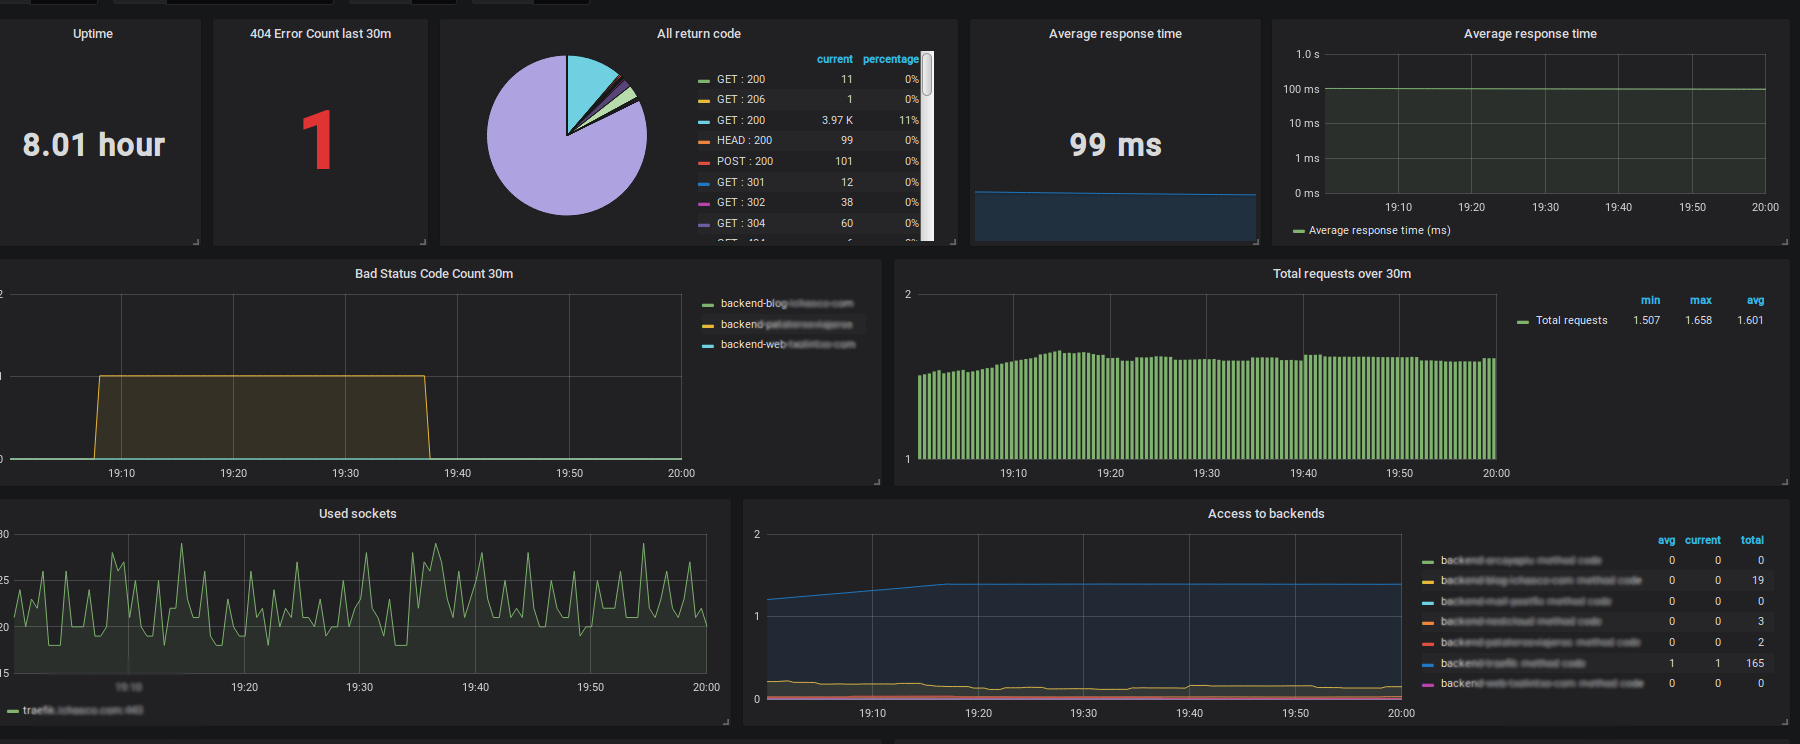
Traefik
Traefik metrics: Status, Average, Errors...
Traefik 1.6.2
To configure it in Prometheus:
  - job_name: 'traefik'
    # If the traefik has authentication
    basic_auth:
        username: user
        password: password
    # If the entrypoint is HTTPS
    scheme: https
    static_configs:
      - targets:
        - traefik.example.com:443
Data source config
Collector config:
Upload an updated version of an exported dashboard.json file from Grafana
| Revision | Description | Created | |
|---|---|---|---|
| Download |
Traefik
Easily monitor Traefik, the dynamic load balancer, with Grafana Cloud's out-of-the-box monitoring solution.
Learn more

