
OpenNMS Outage Dashboard
Dashboard which shows current outages from Nodes, Interfaces and Services in selected Surveillance Categories.
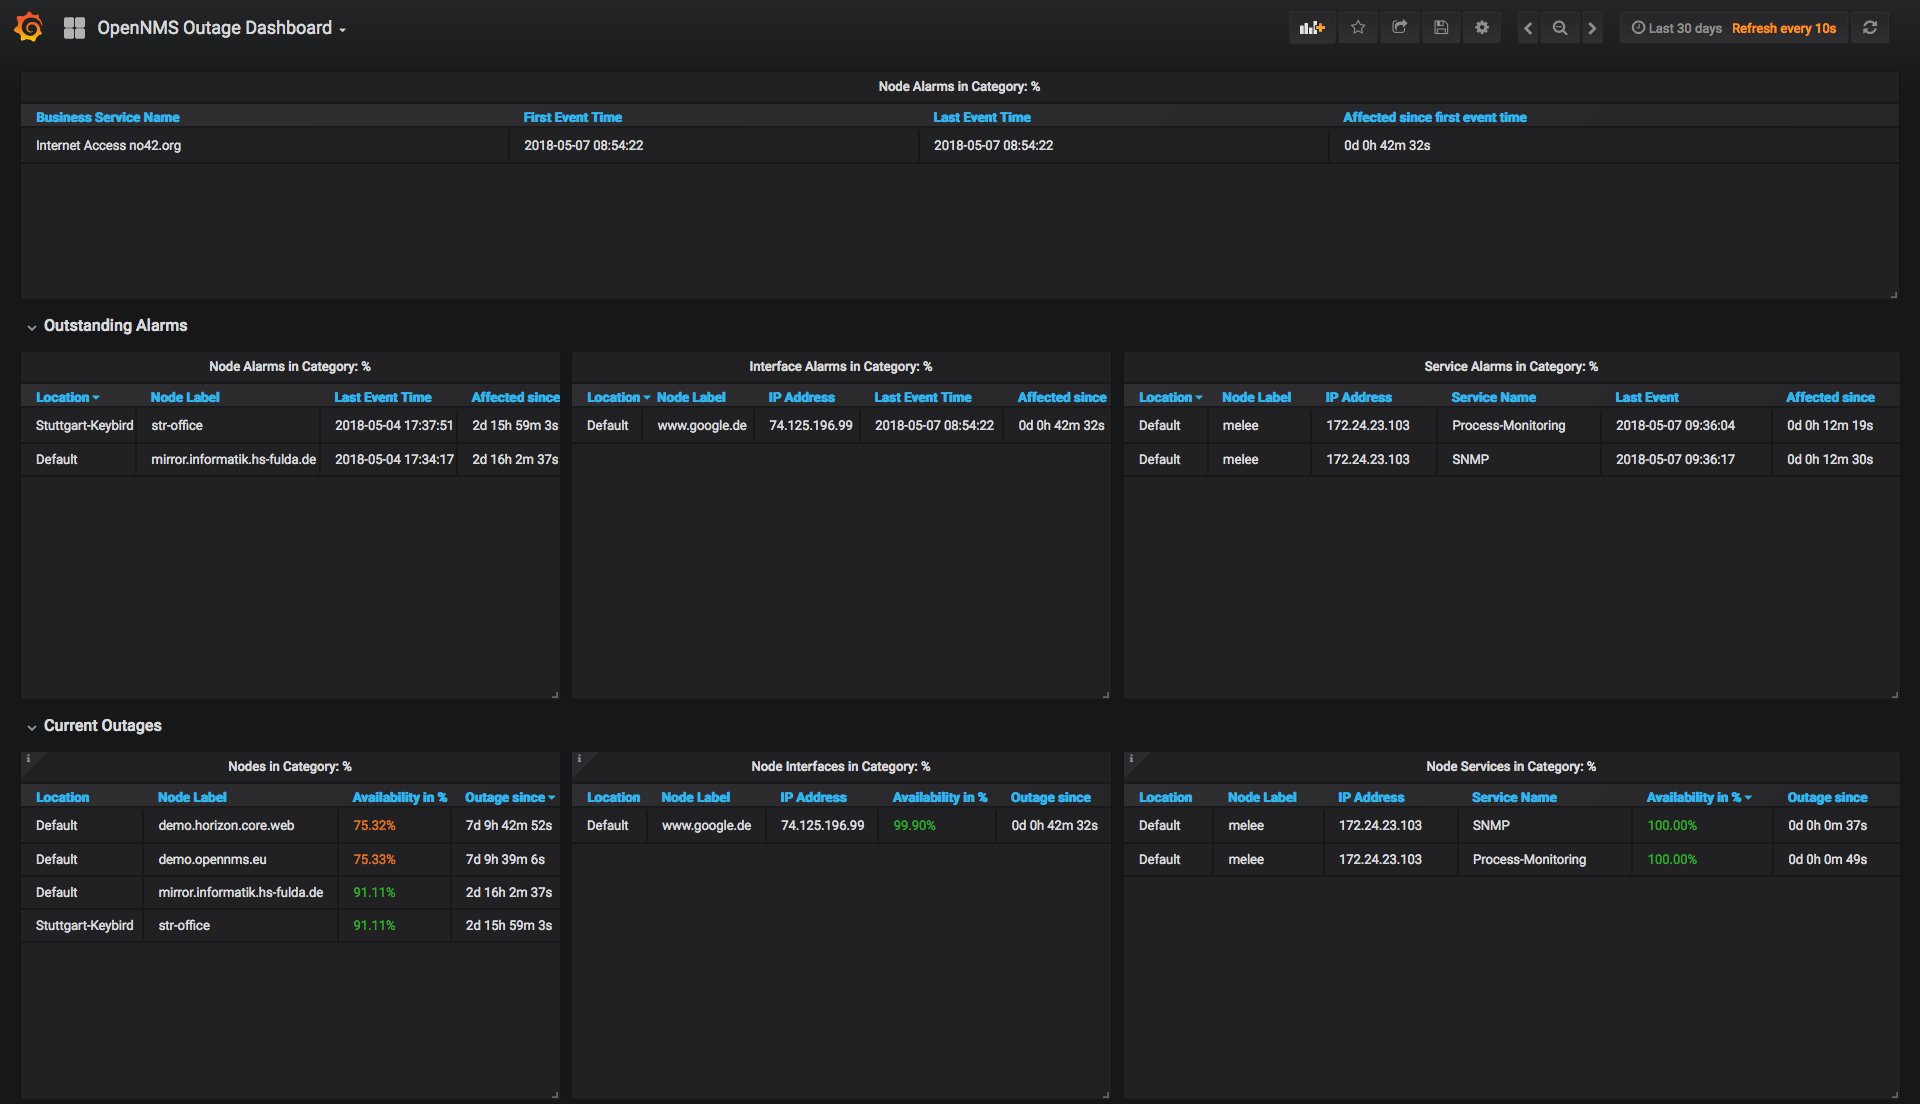
Show availability and alarms from Business Services, Nodes, IP interfaces, and Services. The dashboard requires the Grafana PostgreSQL data source.
Tested with Grafana 12.3.0 and OpenNMS Horizon 35.0.0
Report source available in our Grafana Dashboard GitHub Repository.
Data source config
Collector type:
Collector plugins:
Collector config:
Revisions
Upload an updated version of an exported dashboard.json file from Grafana
| Revision | Description | Created | |
|---|---|---|---|
| Download |