
Kubernetes Status
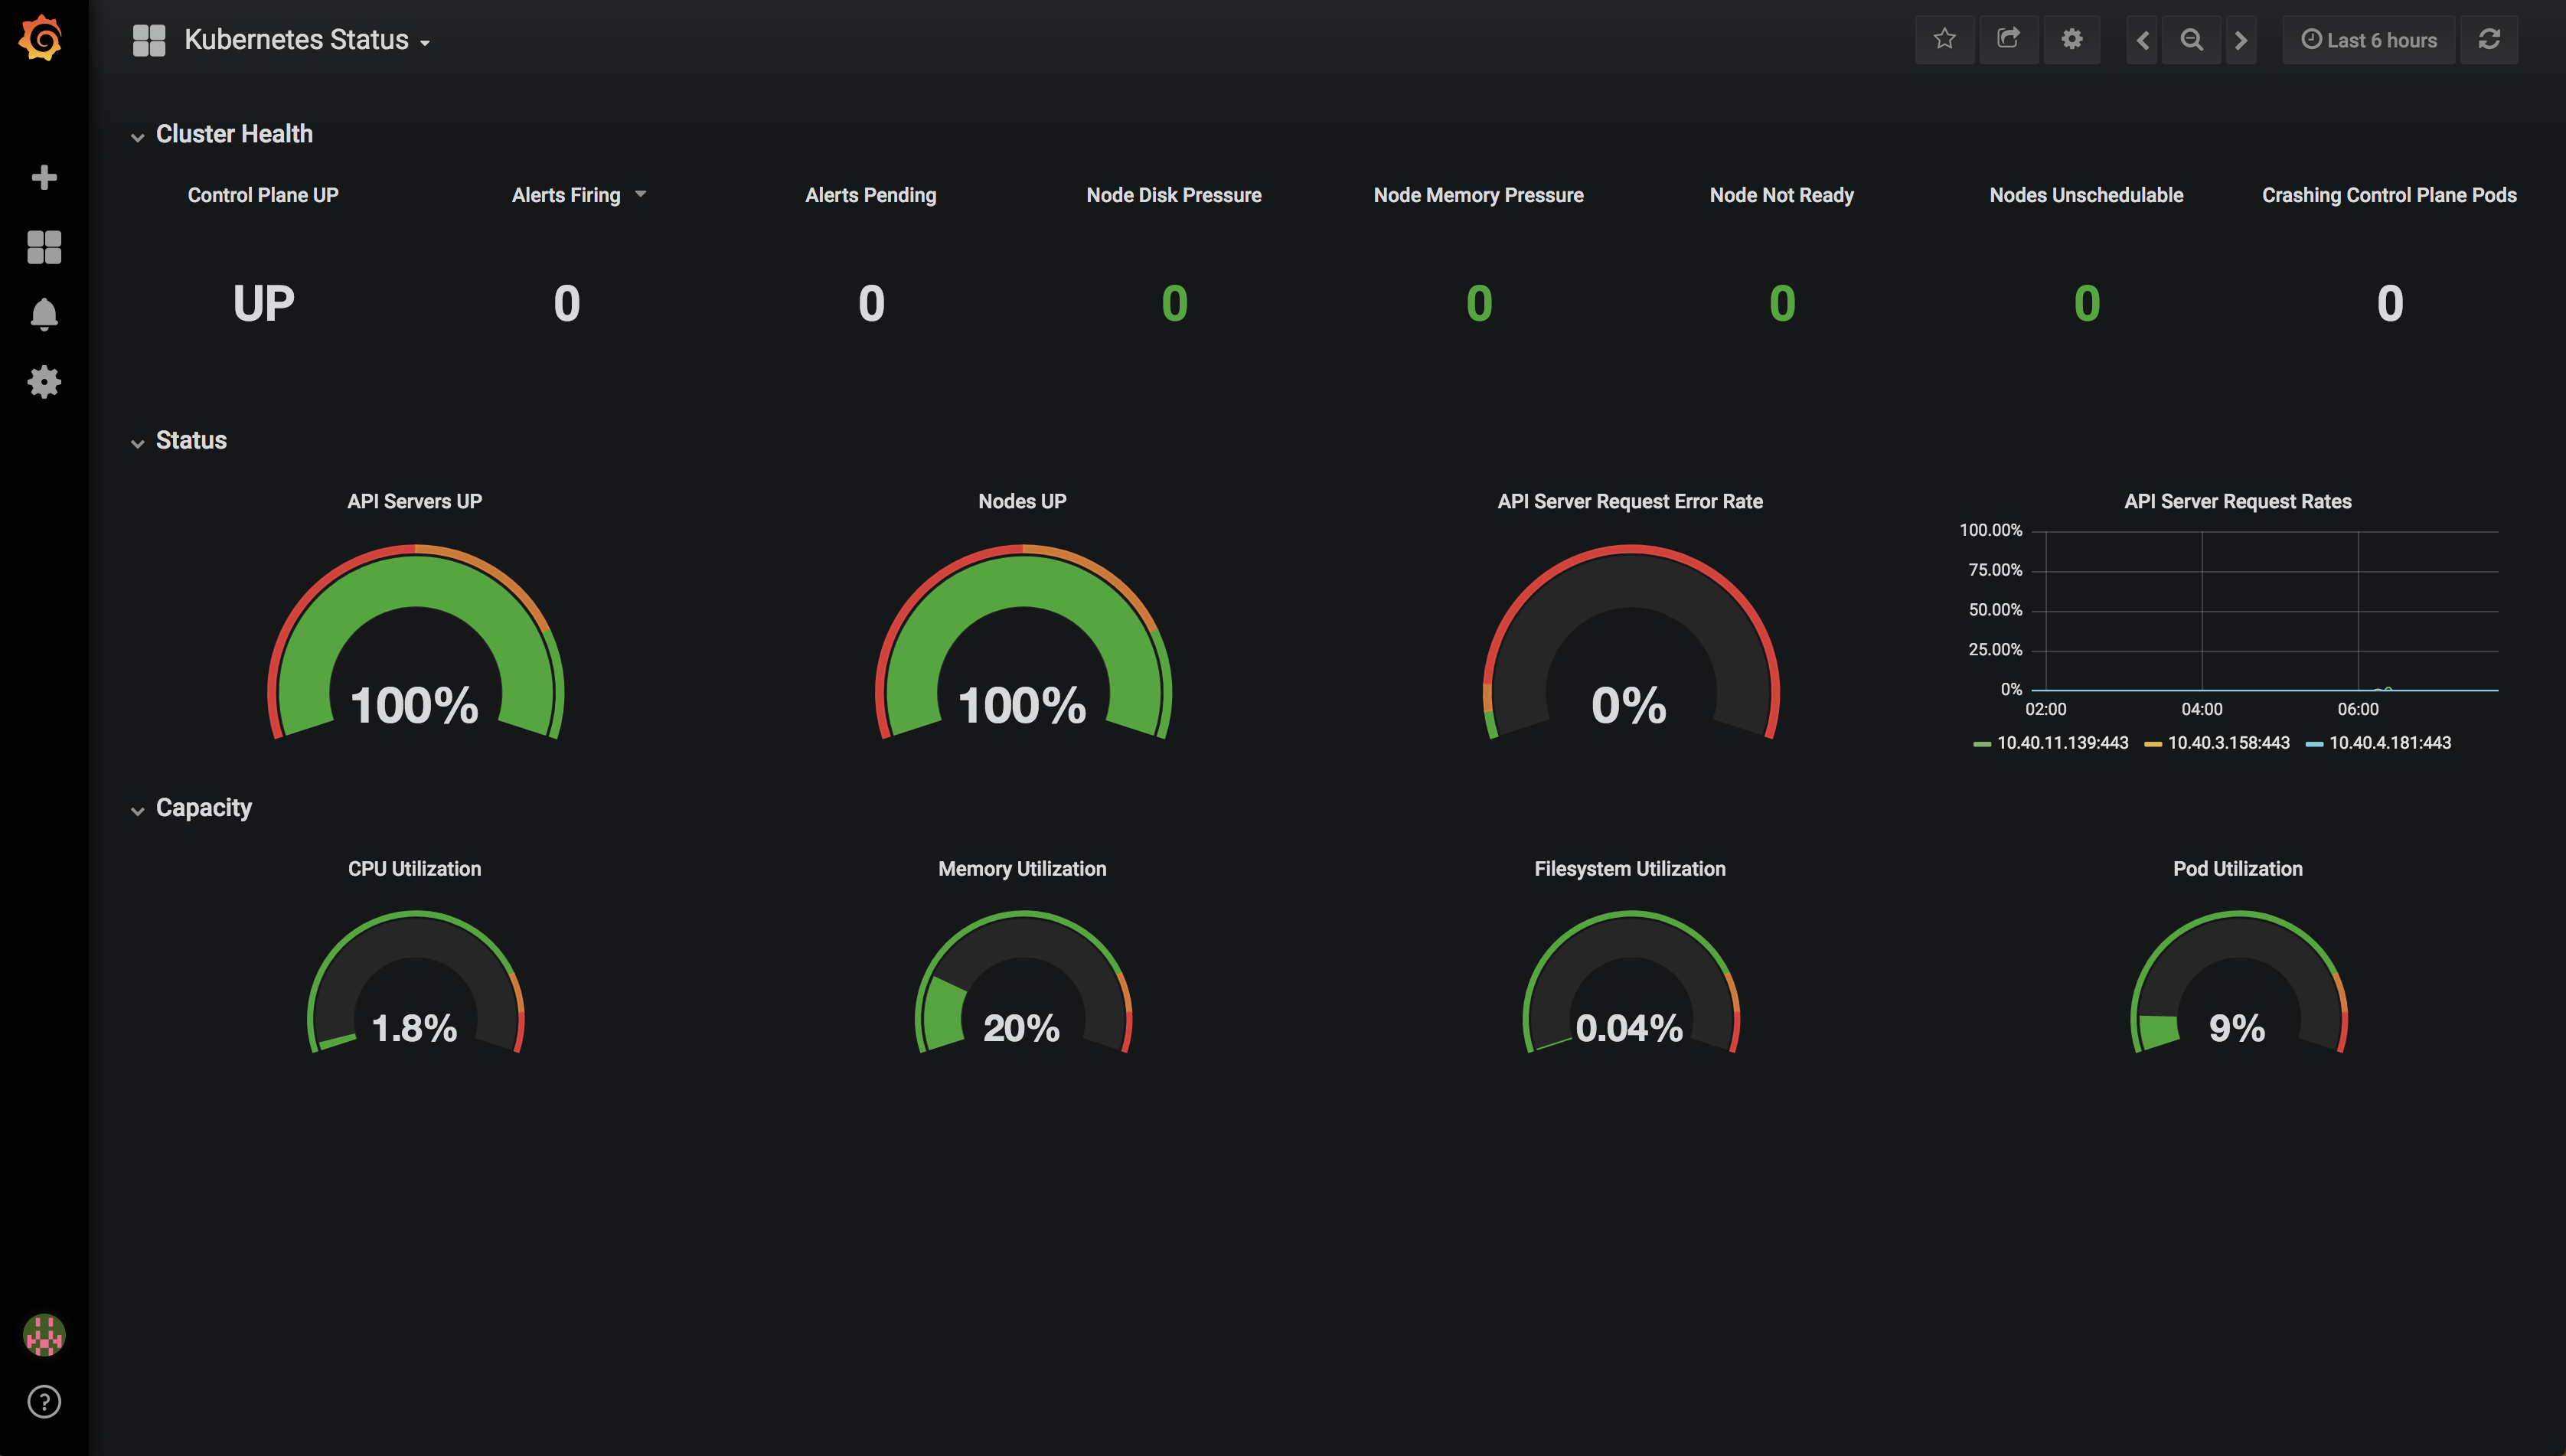
Shows the health of the overall Kubernetes Cluster at a glance.
The configuration is compatible with this instillation of Prometheus - https://github.com/kubernetes/charts/tree/master/stable/prometheus A default node exporter will also likely function.
Dashboard sources - https://github.com/sstarcher/grafana-dashboards
Data source config
Collector type:
Collector plugins:
Collector config:
Revisions
Upload an updated version of an exported dashboard.json file from Grafana
| Revision | Description | Created | |
|---|---|---|---|
| Download |
Kubernetes
Monitor your Kubernetes deployment with prebuilt visualizations that allow you to drill down from a high-level cluster overview to pod-specific details in minutes.
Learn more