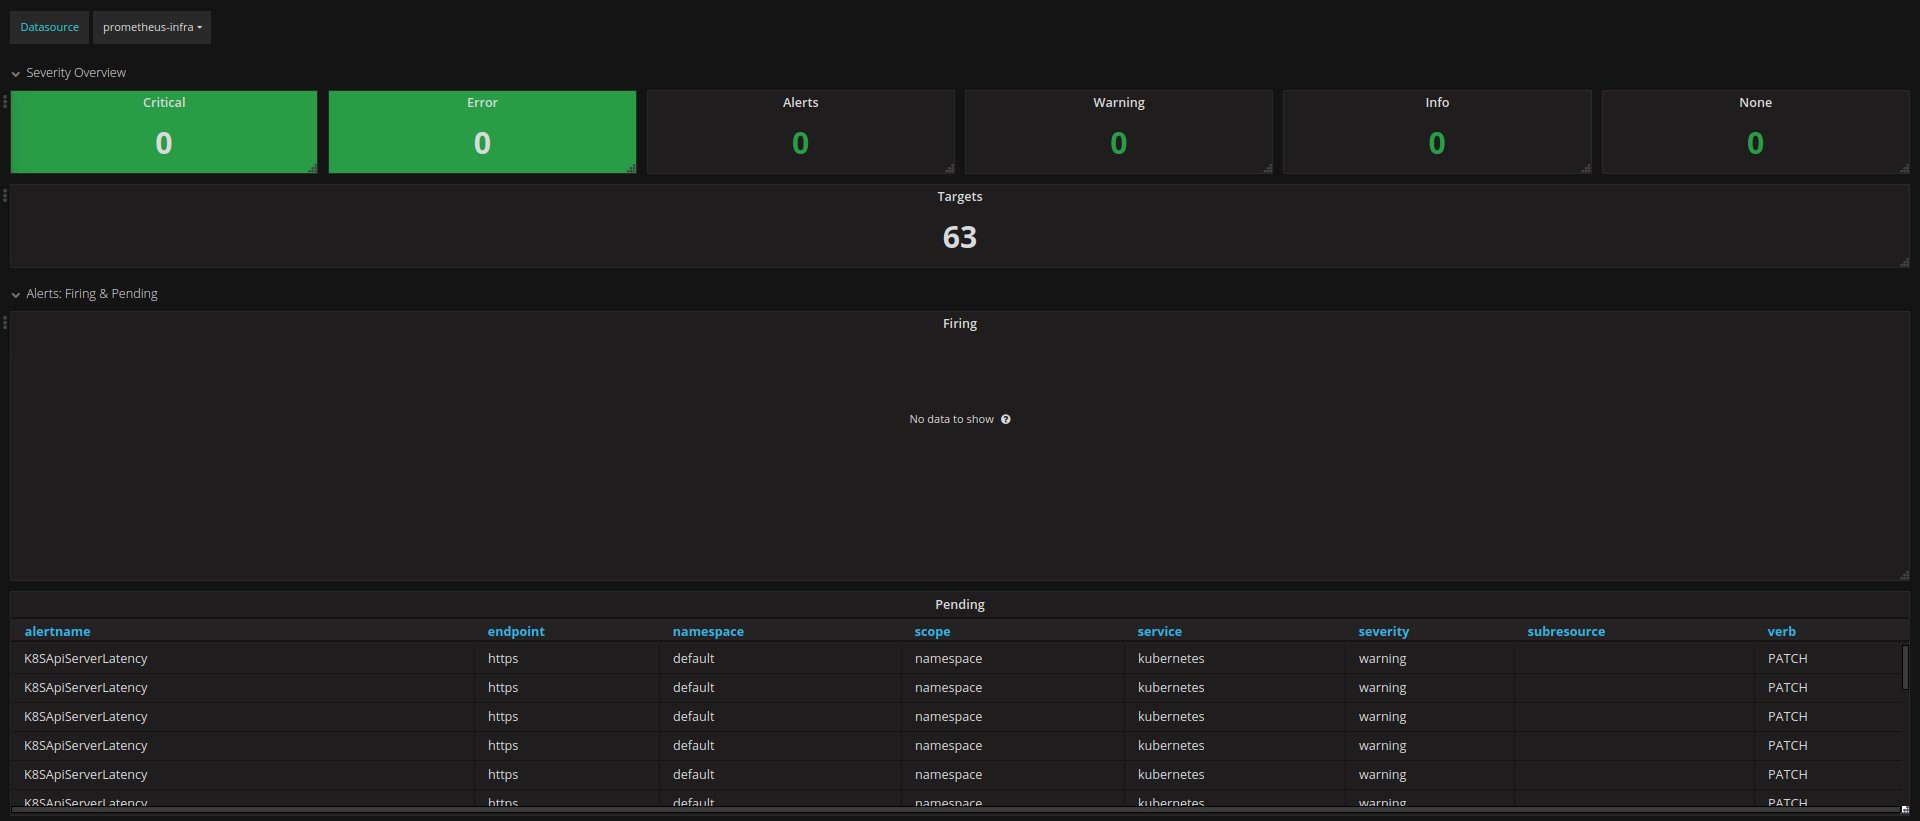
Alerts - Overview
Show current firing and pending alerts, and severity alert counts.
Your Prometheus needs to scrape Alertmanager for the dashboard to work and show proper values.
This dashboard shows severity counts for alerts and the current firing and pending alerts.
Data source config
Collector config:
Upload an updated version of an exported dashboard.json file from Grafana
| Revision | Description | Created | |
|---|---|---|---|
| Download |

