
Ceph Cluster
Ceph cluster dashborad (Monitoring data is from ceph mgr zabbix plugin )
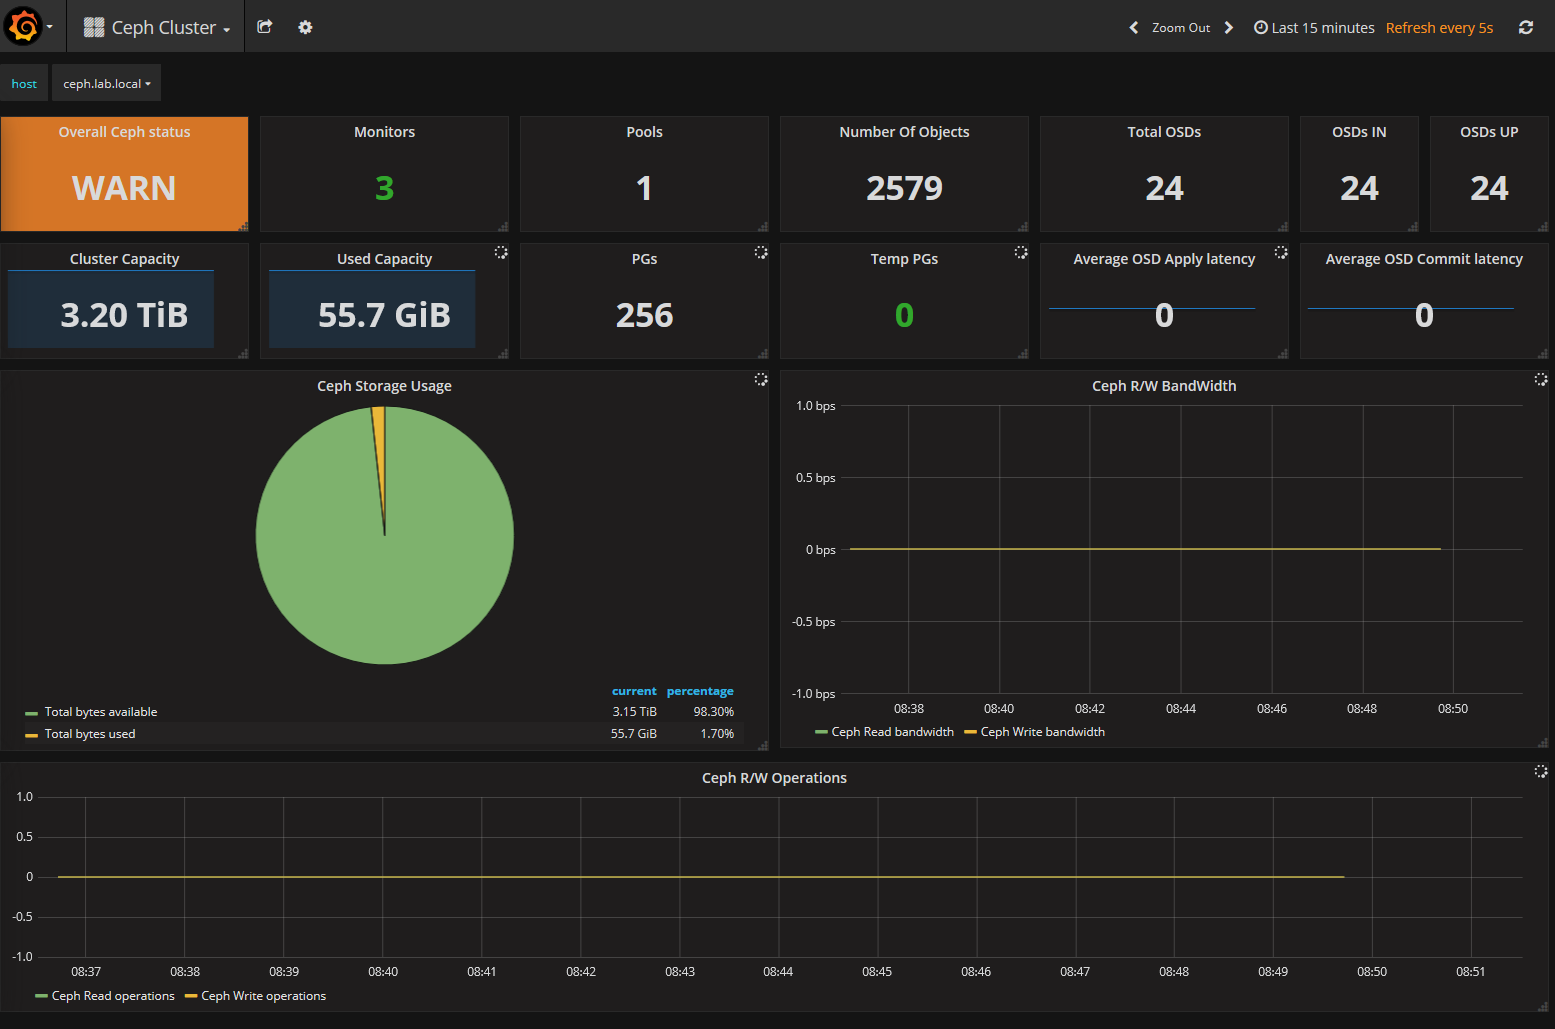
This dashboard is using ceph mgr zabbix plugins to generate monitoring data ,and using zabbix-grafana to fetch data from zabbix to grafana
To enable ceph zabbix plugin,using command below
you can reference this link1 and link2
ceph mgr module zabbix enable
ceph zabbix config-set zabbix_host zabbix.lab.local
ceph zabbix config-set identifier ceph.lab.local
In zabbix:
create a host named with ceph.lab.local( replace your own) ,add to ceph group and link the template "ceph-mgr Zabbix module"
in grafana
you can reference this link
- install the zabbix-grafana plugin and create datasource named zabbix
- import this dashborad
Data source config
Collector type:
Collector plugins:
Collector config:
Revisions
Upload an updated version of an exported dashboard.json file from Grafana
| Revision | Description | Created | |
|---|---|---|---|
| Download |
Ceph
Monitor Ceph with Grafana. Easily keep tabs on your cluster with Grafana Cloud's out-of-the-box monitoring solution.
Learn more