
Elasticsearch Cluster - Nodes
An Elasticsearch monitoring dashboard / the node part to monitor data sent by x-pack
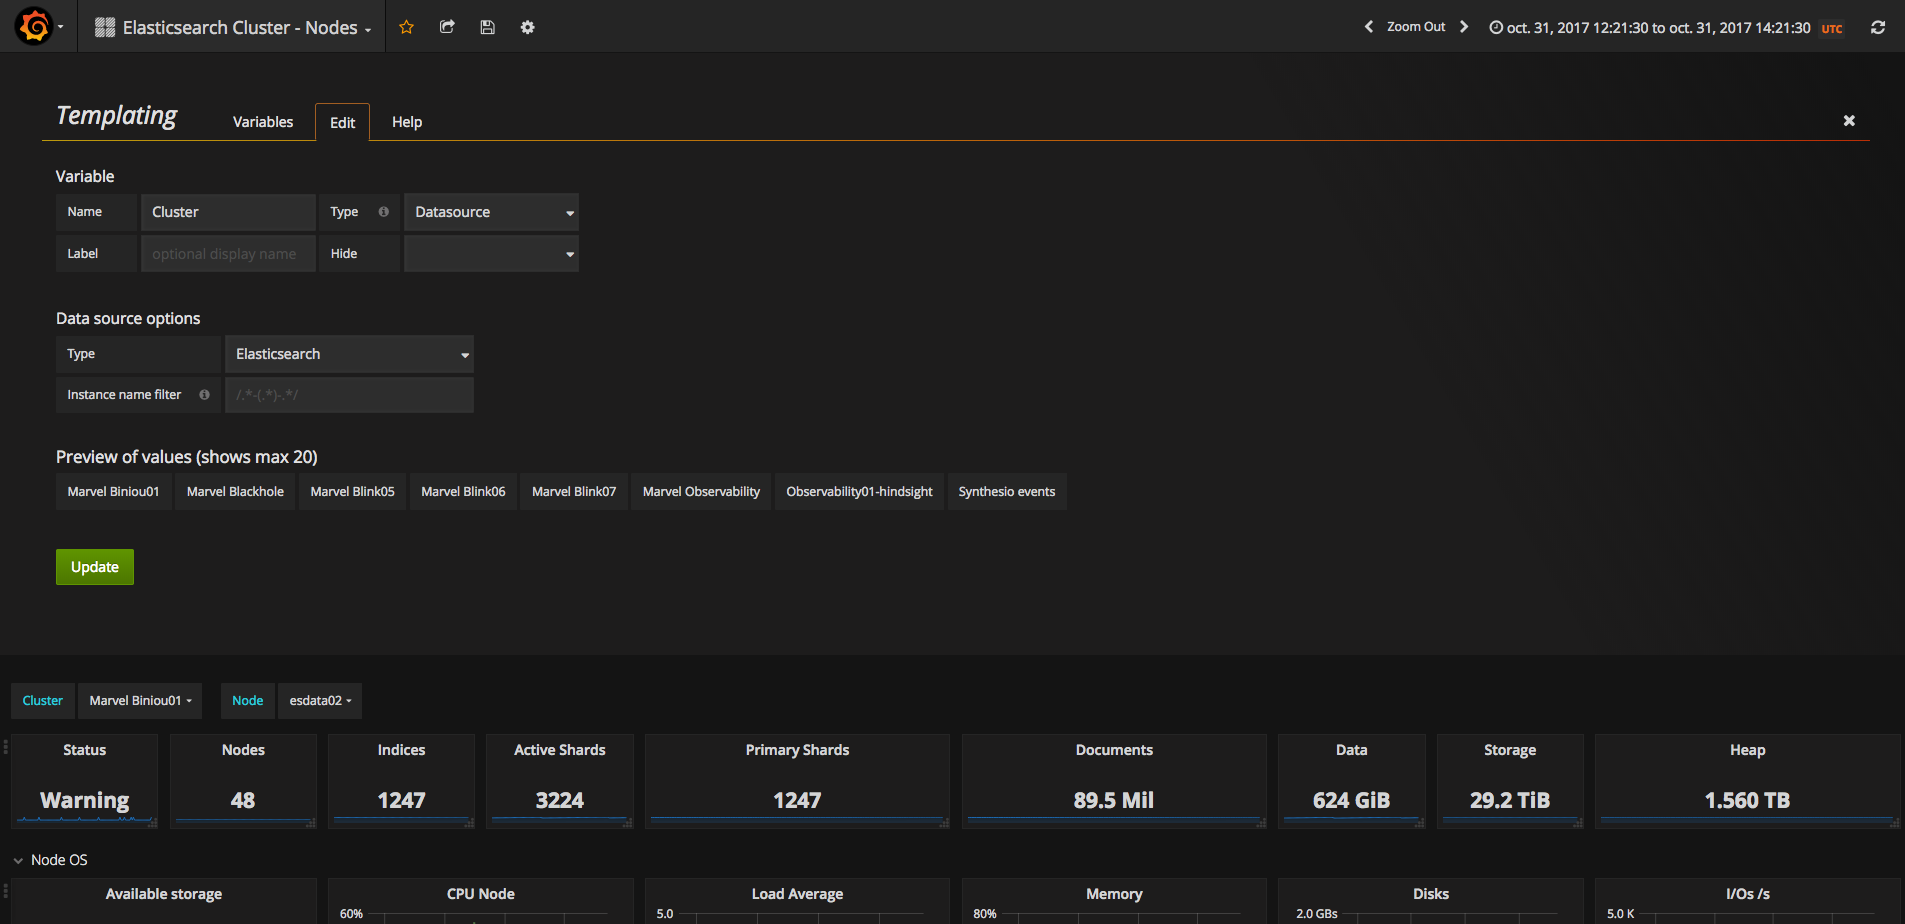
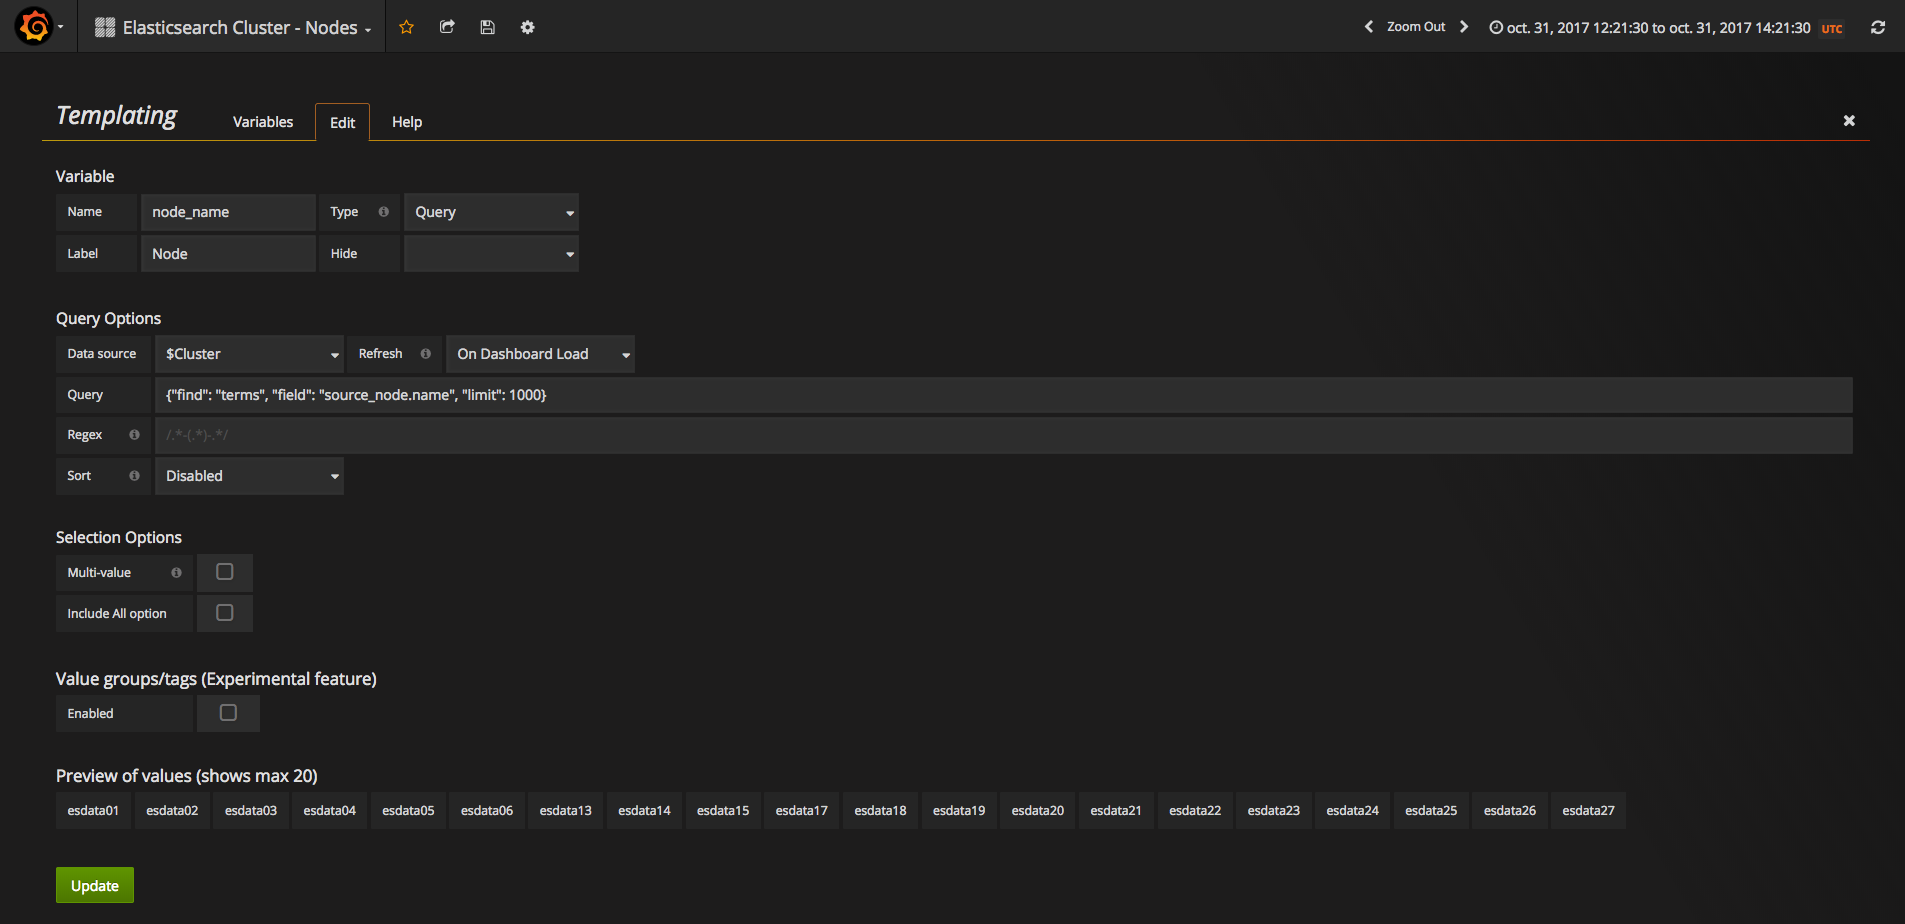
This dashboard is the second of 3 to monitor a cluster using the data collected through the x-pack monitoring collector. It takes data sources starting with Monitoring so you don't confuse your monitoring and production clusters.
See https://grafana.com/dashboards/3592 for the overview dash See https://grafana.com/dashboards/3598 for the indexes dashboard
Data source config
Collector type:
Collector plugins:
Collector config:
Revisions
Upload an updated version of an exported dashboard.json file from Grafana
| Revision | Description | Created | |
|---|---|---|---|
| Download |
Elasticsearch
Easily monitor Elasticsearch, a distributed, multitenant full-text search engine, with Grafana Cloud's out-of-the-box monitoring solution.
Learn more