
JMX Overview
Dashboard for JVM metrics with Prometheus / JMX Exporter
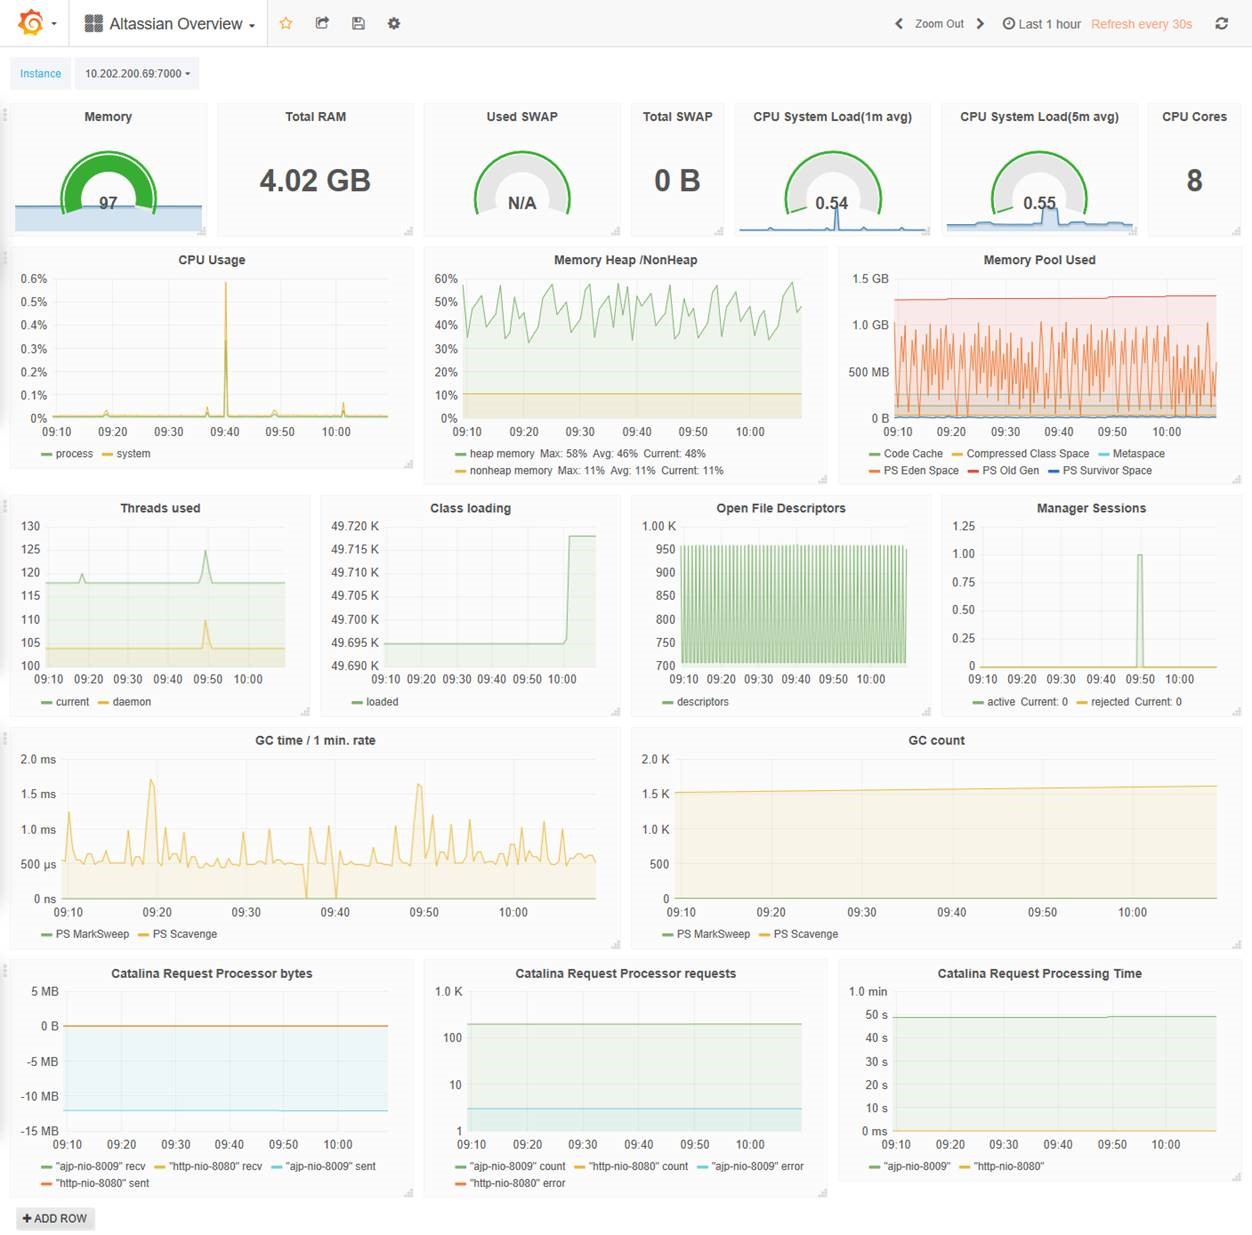
inspired by Joel Takvorian's JVM Overview
Adding more metrics in Dashboard
Data source config
Collector type:
Collector plugins:
Collector config:
Revisions
Upload an updated version of an exported dashboard.json file from Grafana
| Revision | Description | Created | |
|---|---|---|---|
| Download |