
MongoDB
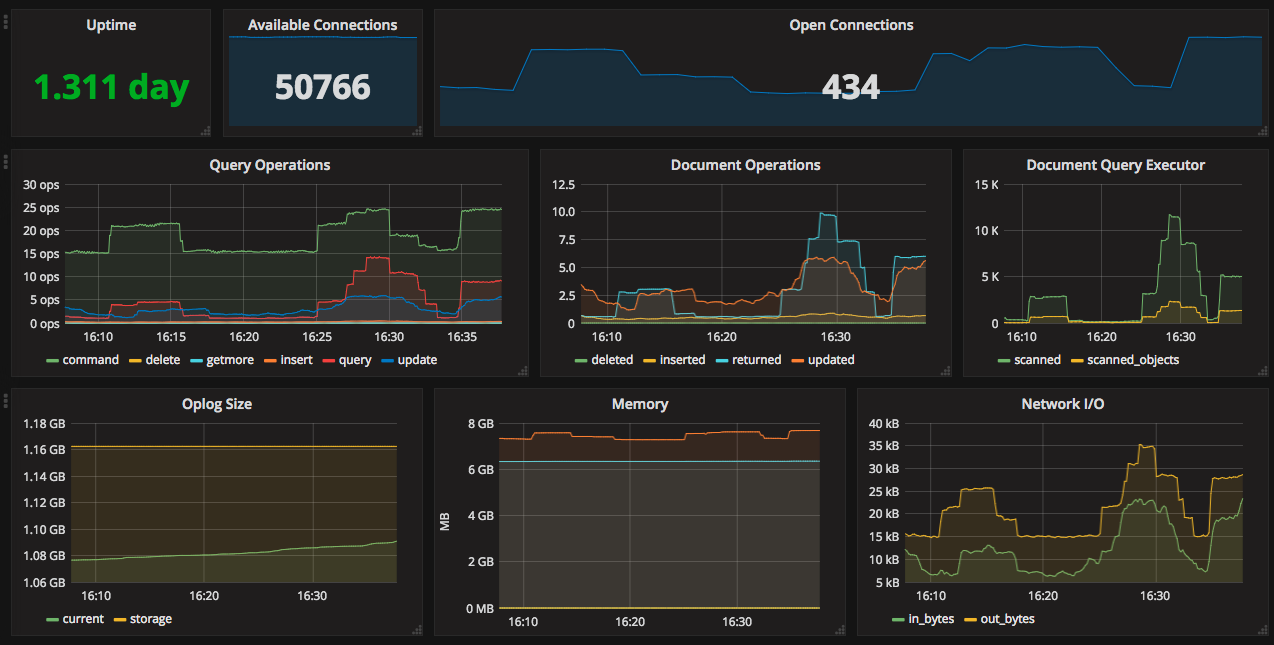
Note for a official Grafana MongoDB plugin, please view: https://grafana.com/grafana/plugins/grafana-mongodb-datasource This is a MongoDB Prometheus Exporter Dashboard. Works well with https://github.com/dcu/mongodb_exporter If you have the node_exporter running on the mongo instance, you will also get some useful alert panels related to disk io and cpu.
Note for a official Grafana MongoDB plugin, please view: https://grafana.com/grafana/plugins/grafana-mongodb-datasource
MongoDB Prometheus Exporter Dashboard. Works well with https://github.com/dcu/mongodb_exporter
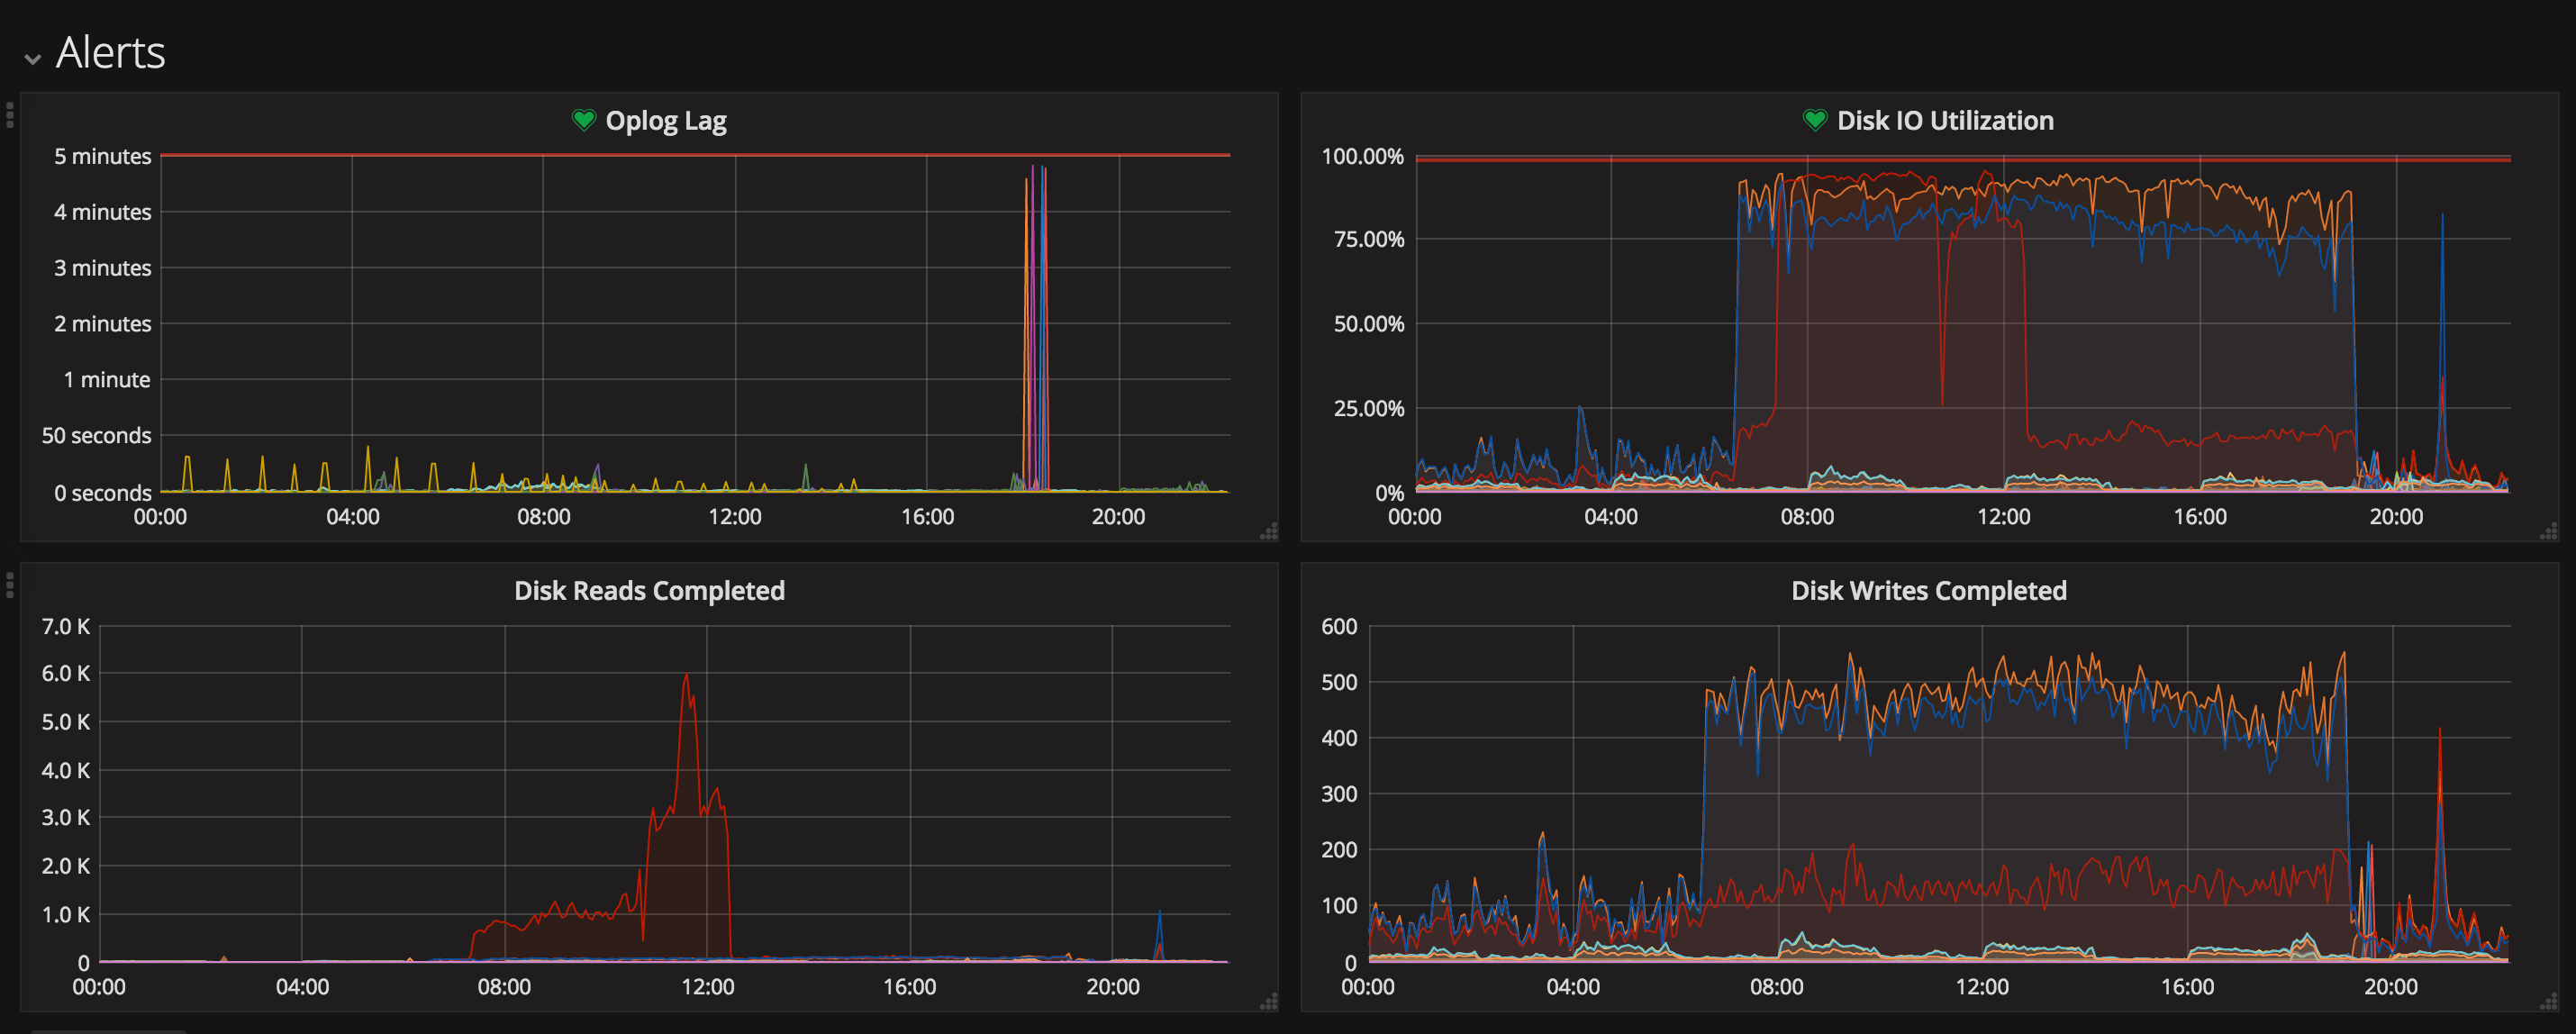
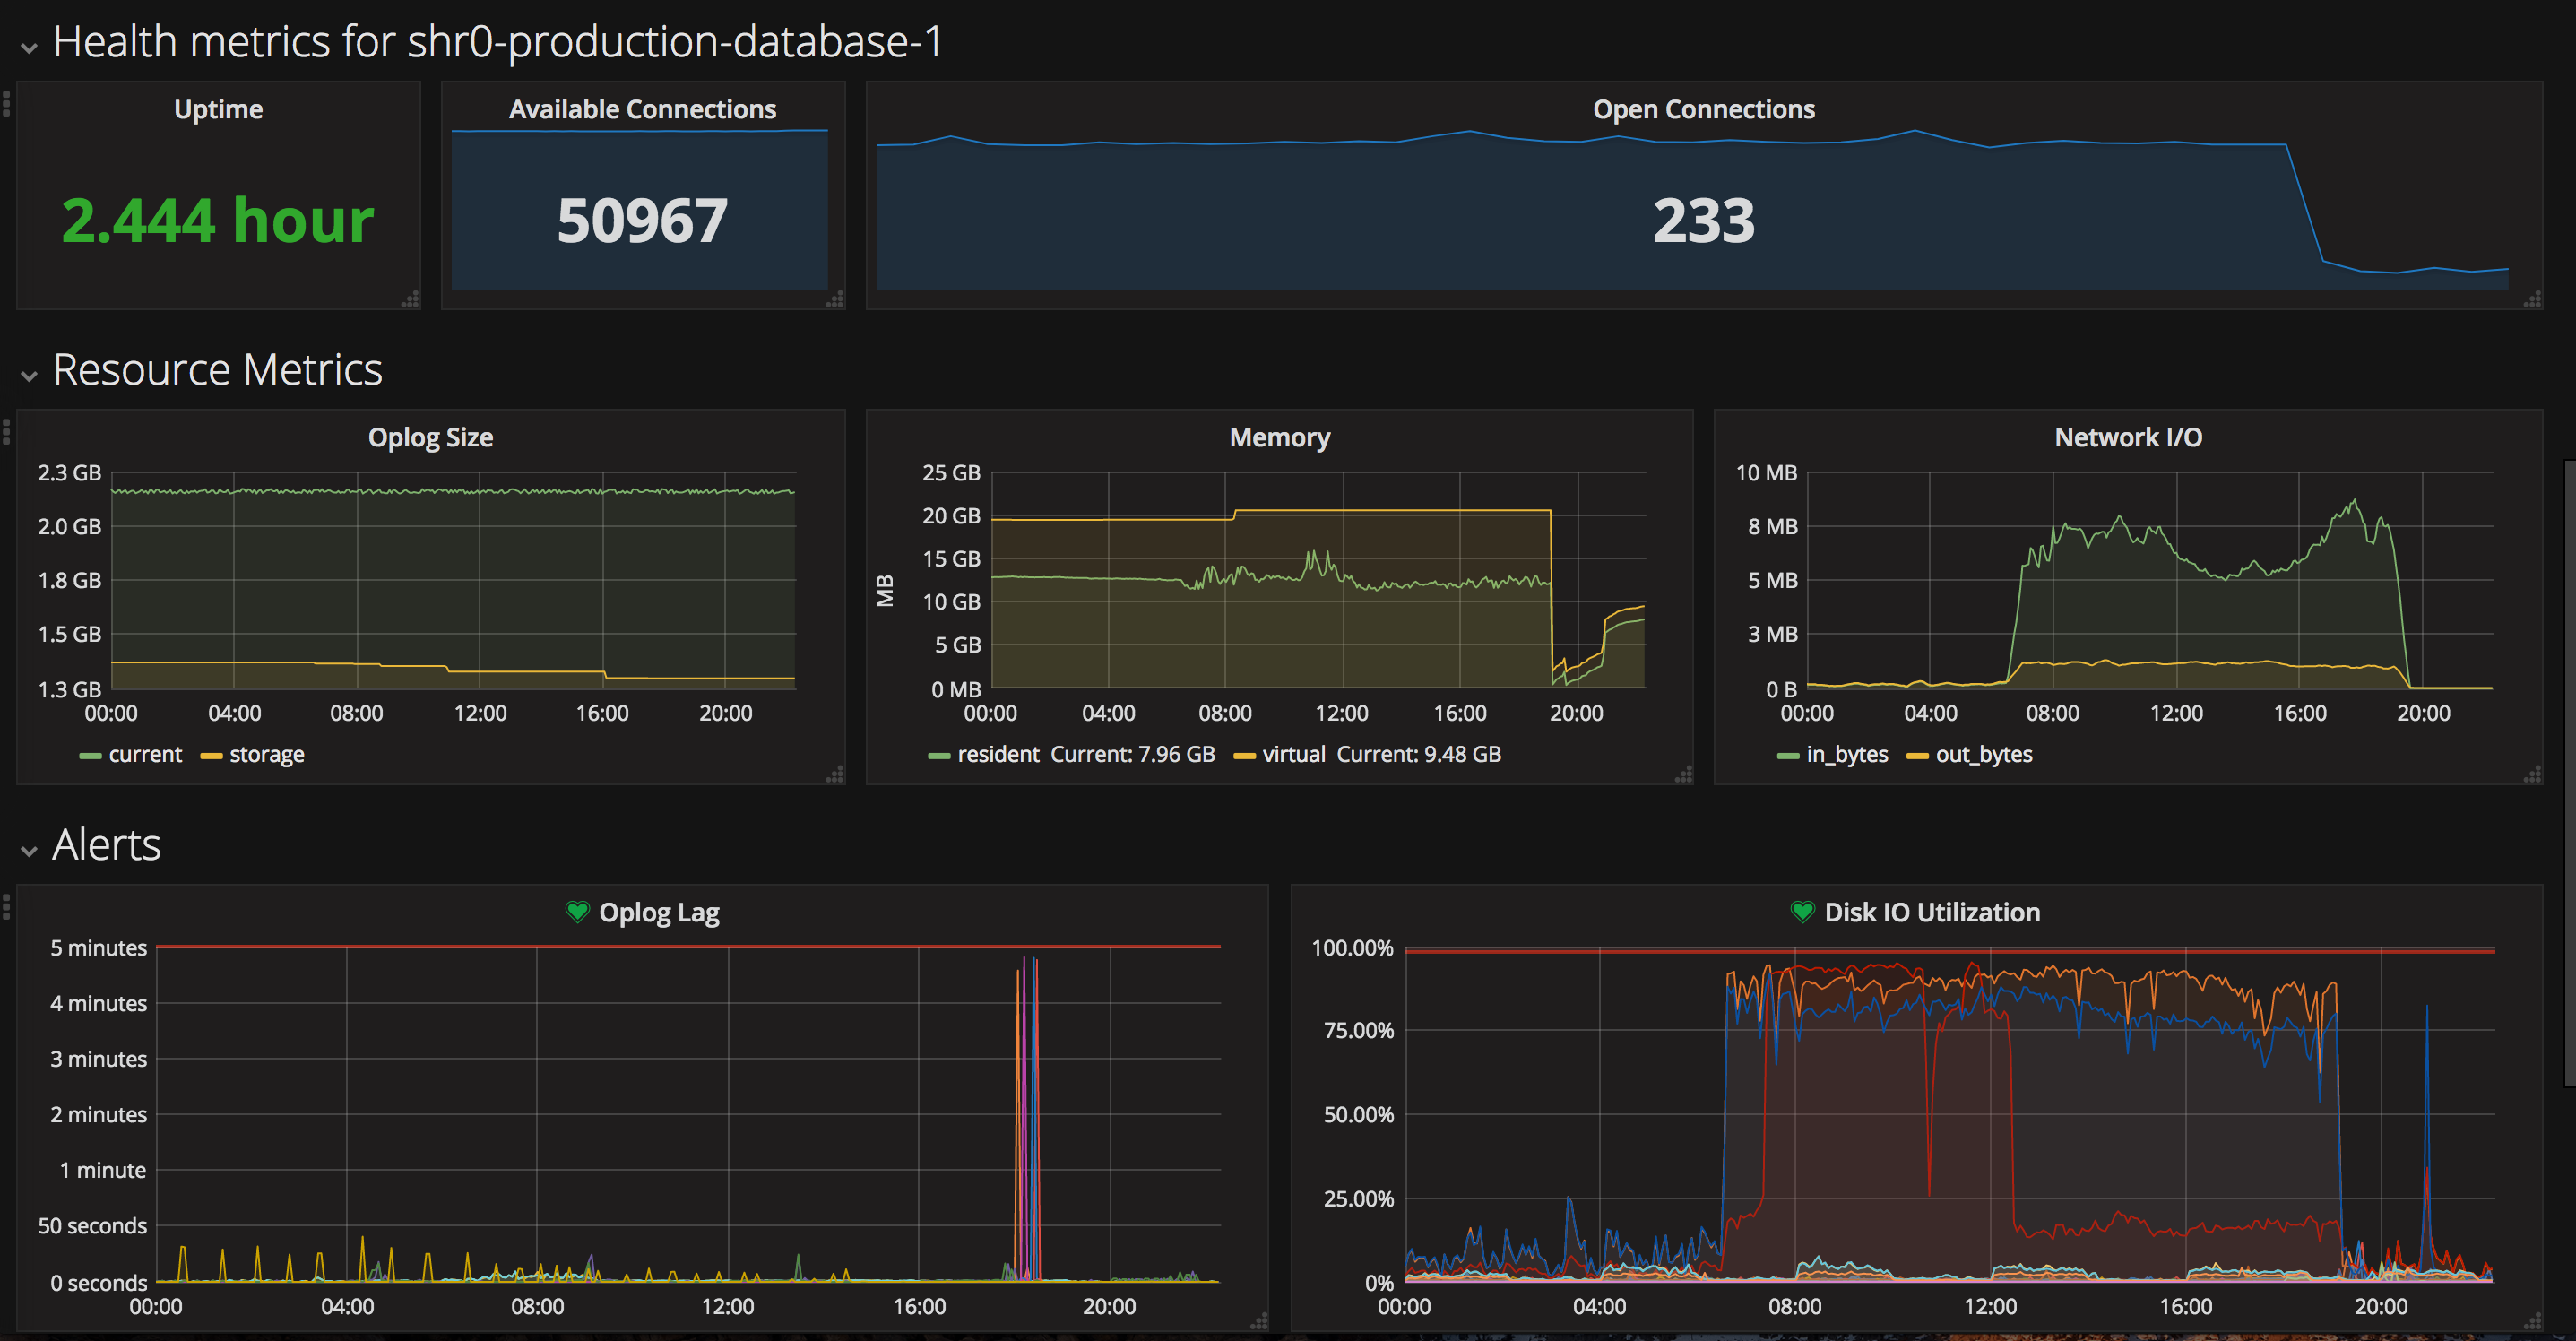
If you have the node_exporter running on the mongo instance, you will also get some useful alert panels related to disk io and cpu.
Data source config
Collector config:
Upload an updated version of an exported dashboard.json file from Grafana
| Revision | Description | Created | |
|---|---|---|---|
| Download |
MongoDB
Easily monitor MongoDB, a general purpose, document-based, distributed database, with Grafana Cloud's out-of-the-box monitoring solution.
Learn more