
Slurm Native OpenMetrics
Comprehensive Slurm monitoring using slurmctld native OpenMetrics endpoint (port 6817). Covers cluster summary, job trends, per-node resources, per-partition status, per-user workloads, and scheduler internals (backfill, RPC latency, threads).
Slurm Native OpenMetrics Dashboard
Monitor your Slurm HPC cluster using the native OpenMetrics
endpoint built into slurmctld (port 6817). No third-party
exporter required.
Prerequisites
- Slurm 24.05+ with native OpenMetrics enabled
- Prometheus scraping slurmctld on port 6817
- Grafana 10+
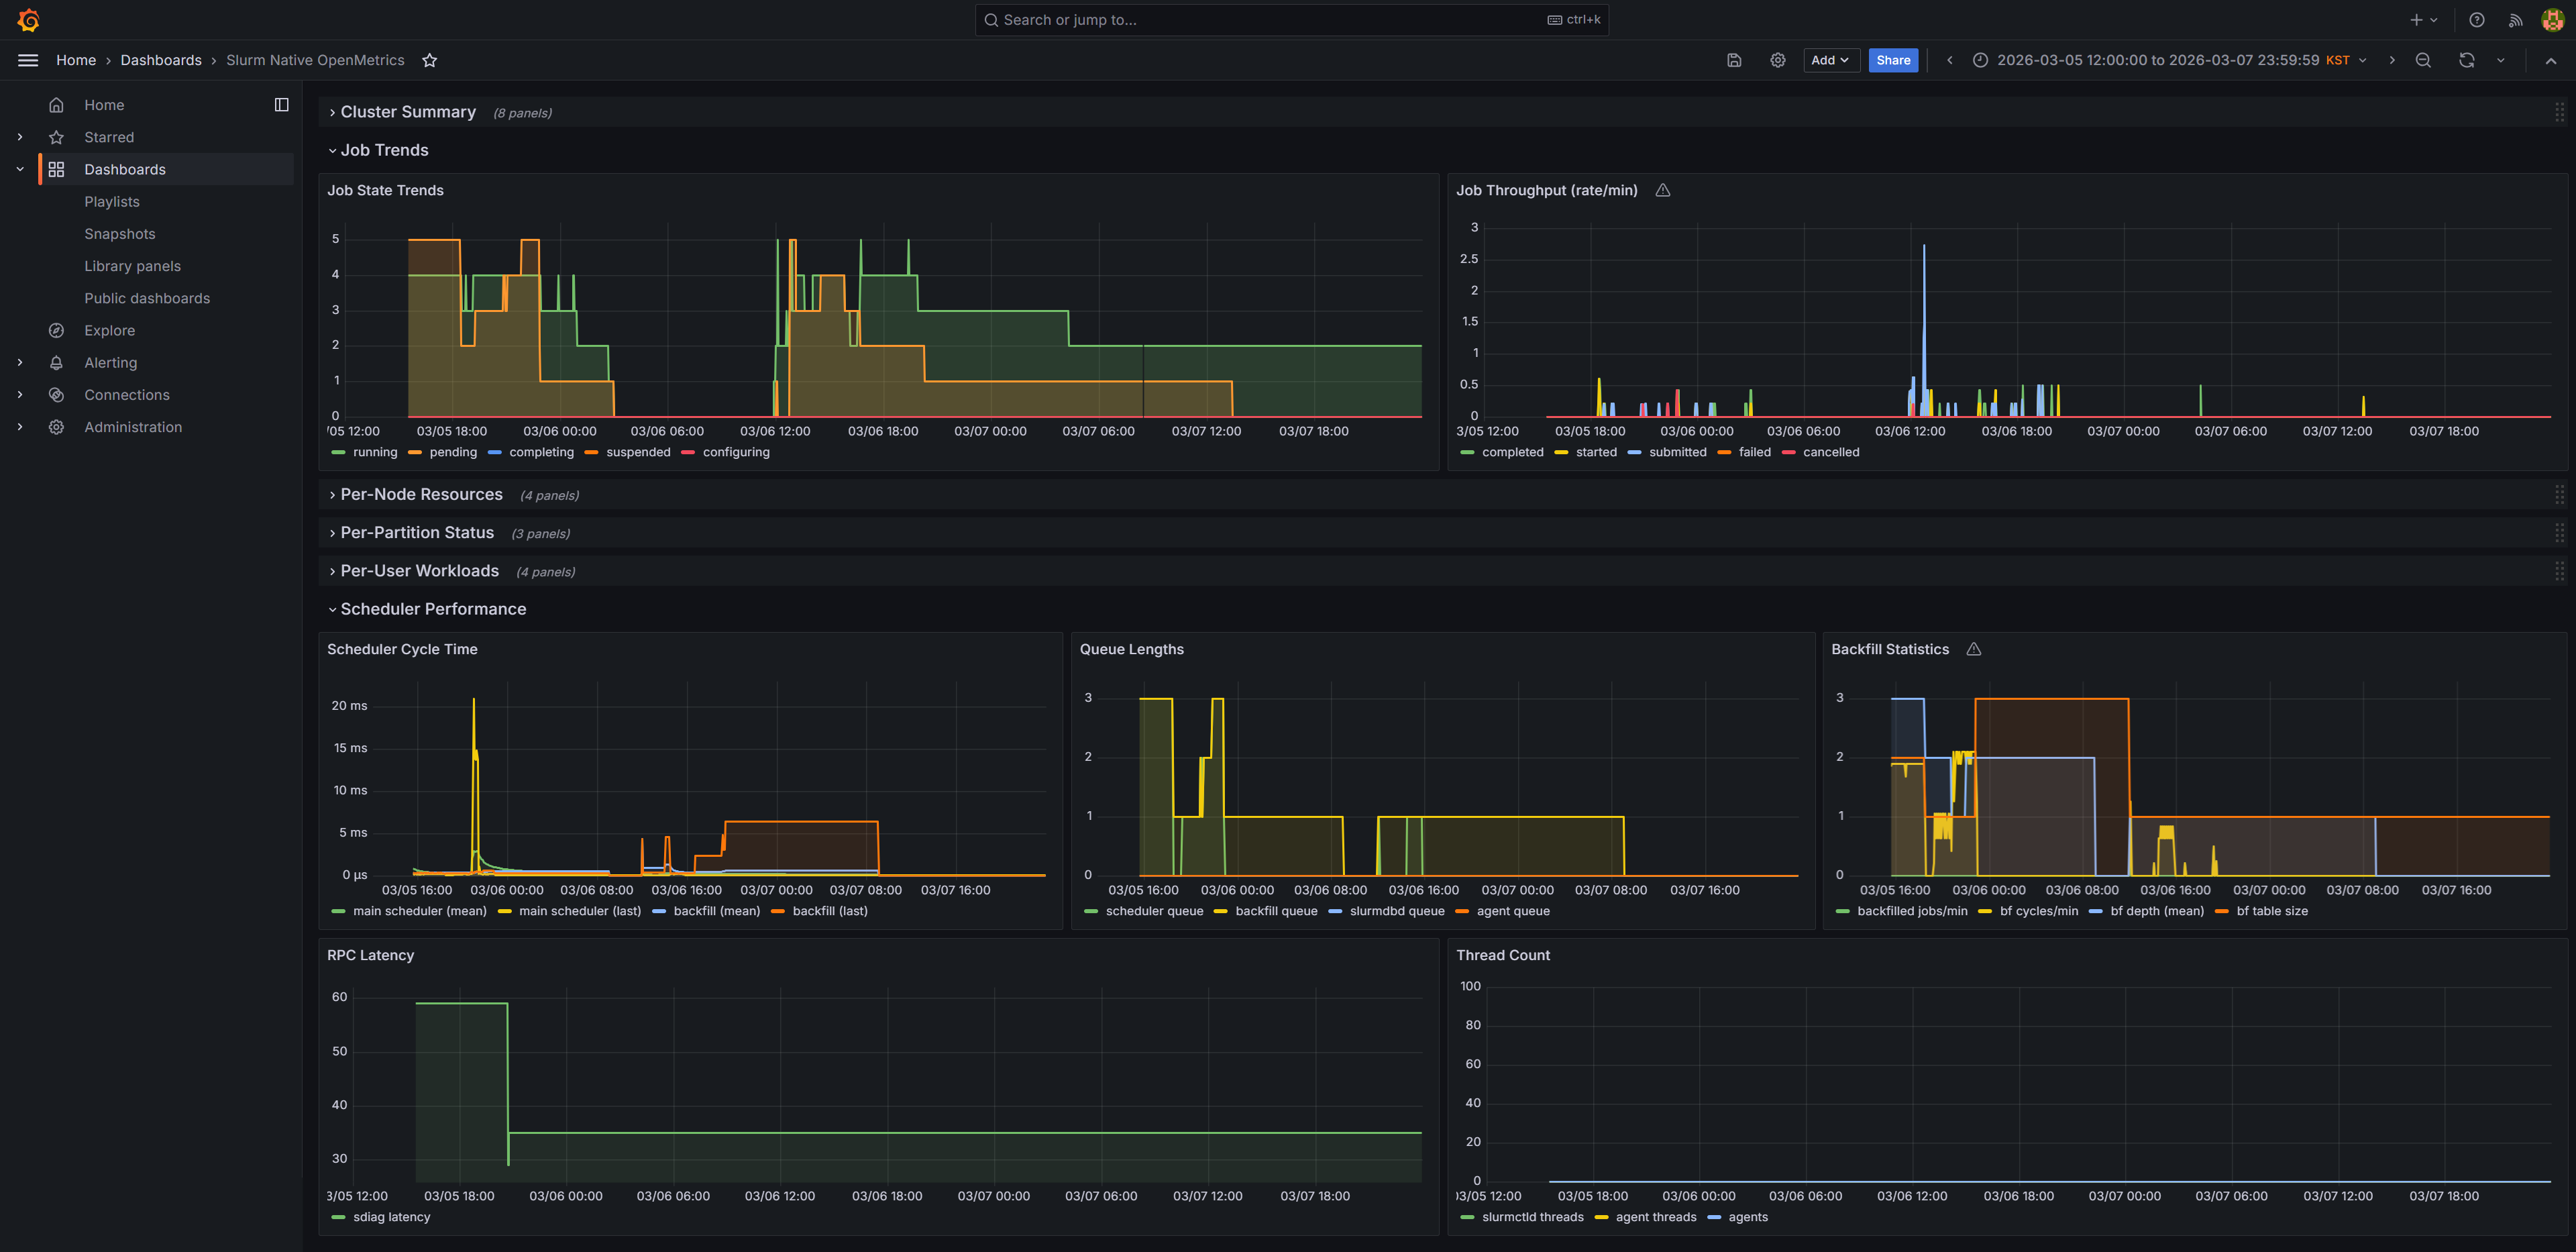
Dashboard Sections (30 panels)
- Cluster Summary — Running/pending jobs, CPU & memory utilization, node states
- Job Trends — Job state trends, throughput rates (completed/started/failed per min)
- Per-Node Resources — CPU & memory allocation and utilization by node
- Per-Partition Status — Running/pending jobs and CPU allocation by partition
- Per-User Workloads — Jobs and resource usage by user (inactive users auto-hidden)
- Scheduler Performance — Cycle times, queue lengths, backfill stats, RPC latency
Notes
- Uses Slurm's native OpenMetrics — not a third-party exporter
- No hardcoded hostnames or cluster-specific values
- Default time range: last 6 hours
Data source config
Collector type:
Collector plugins:
Collector config:
Revisions
Upload an updated version of an exported dashboard.json file from Grafana
| Revision | Description | Created | |
|---|---|---|---|
| Download |