
Named processes
Process metrics exported by https://github.com/ncabatoff/process-exporter.
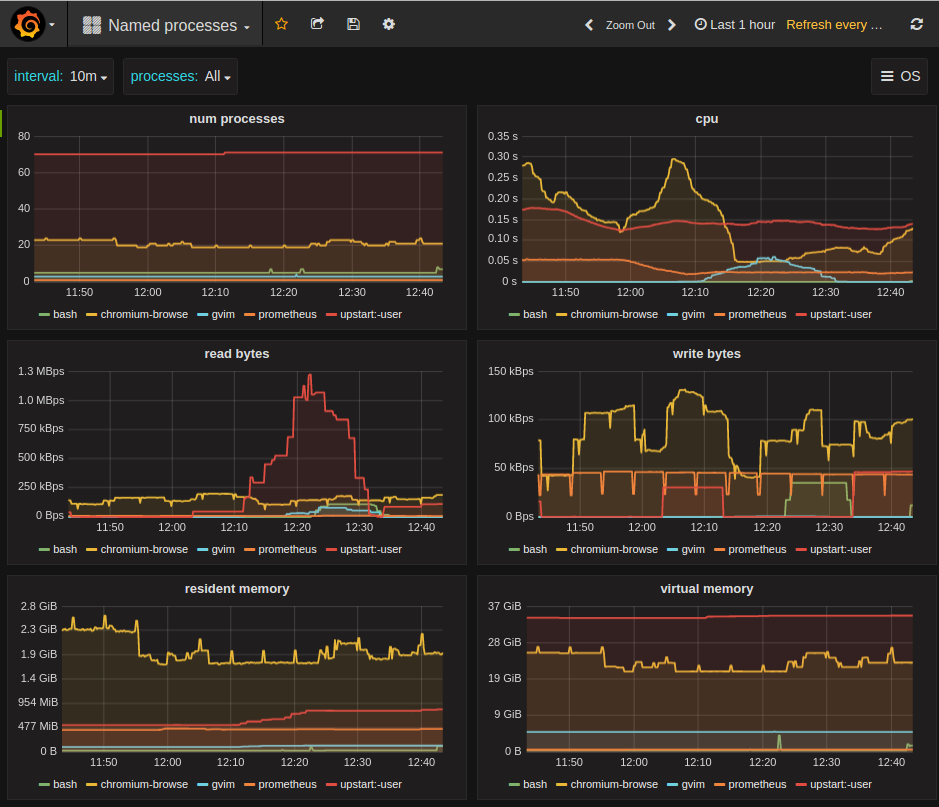
Metrics shown (each broken down by group name): number of processes, memory usage (resident and virtual), CPU consumption, and I/O (bytes read and written).
See also https://grafana.net/dashboards/715 for the same data shown using stacked bar graphs.
Data source config
Collector type:
Collector plugins:
Collector config:
Revisions
Upload an updated version of an exported dashboard.json file from Grafana
| Revision | Description | Created | |
|---|---|---|---|
| Download |