
Notifiarr Client
Dashboard to visualize the Notifiarr Client metrics exported to Prometheus.
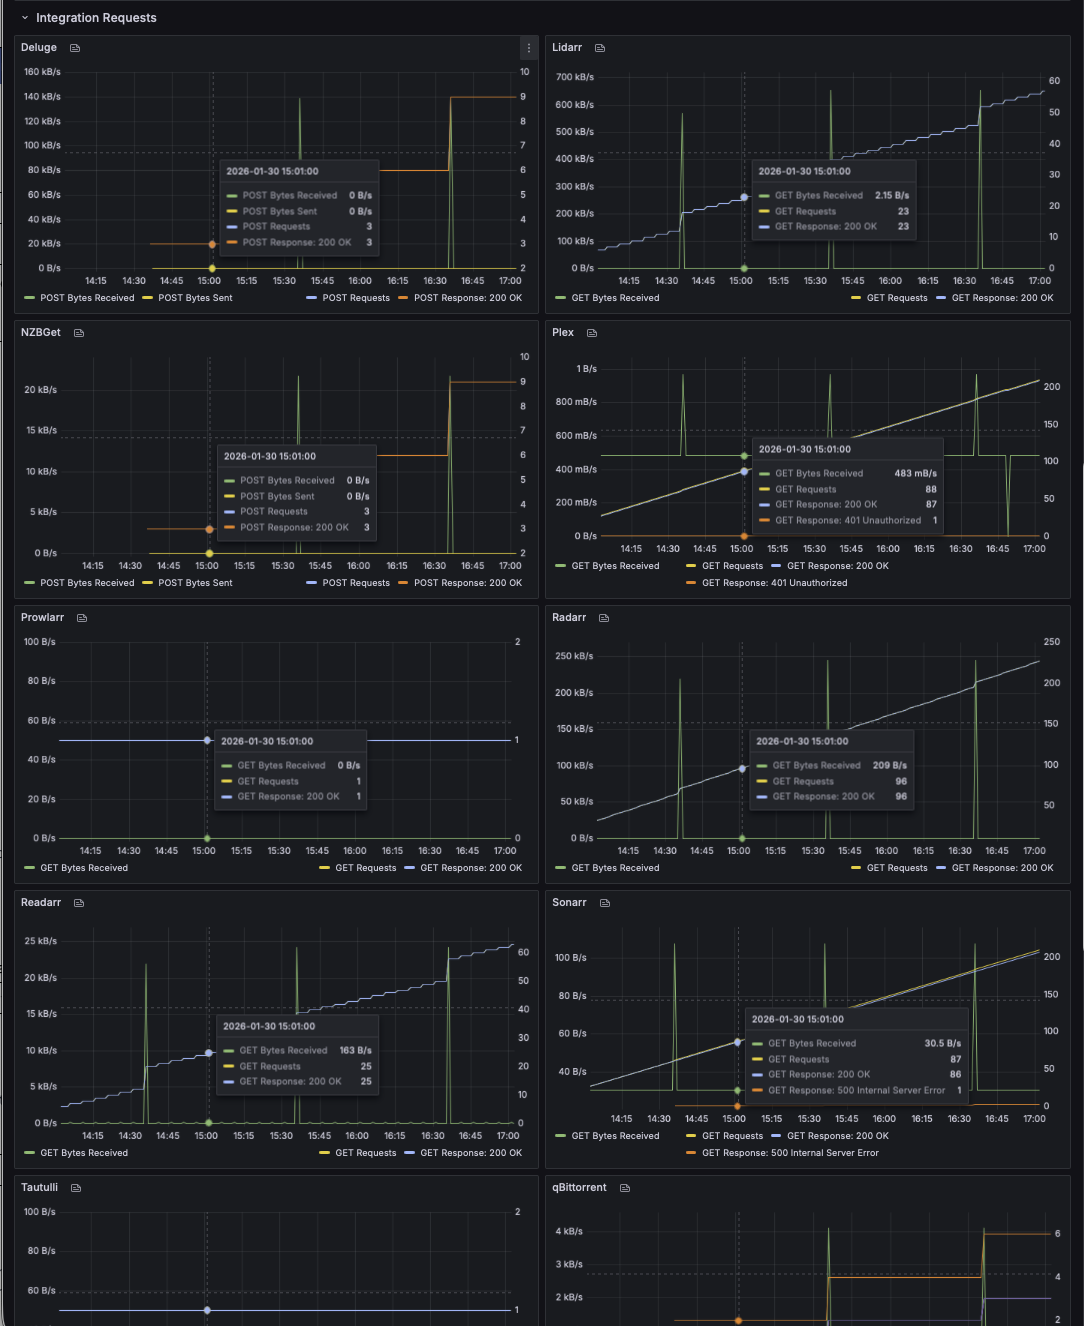
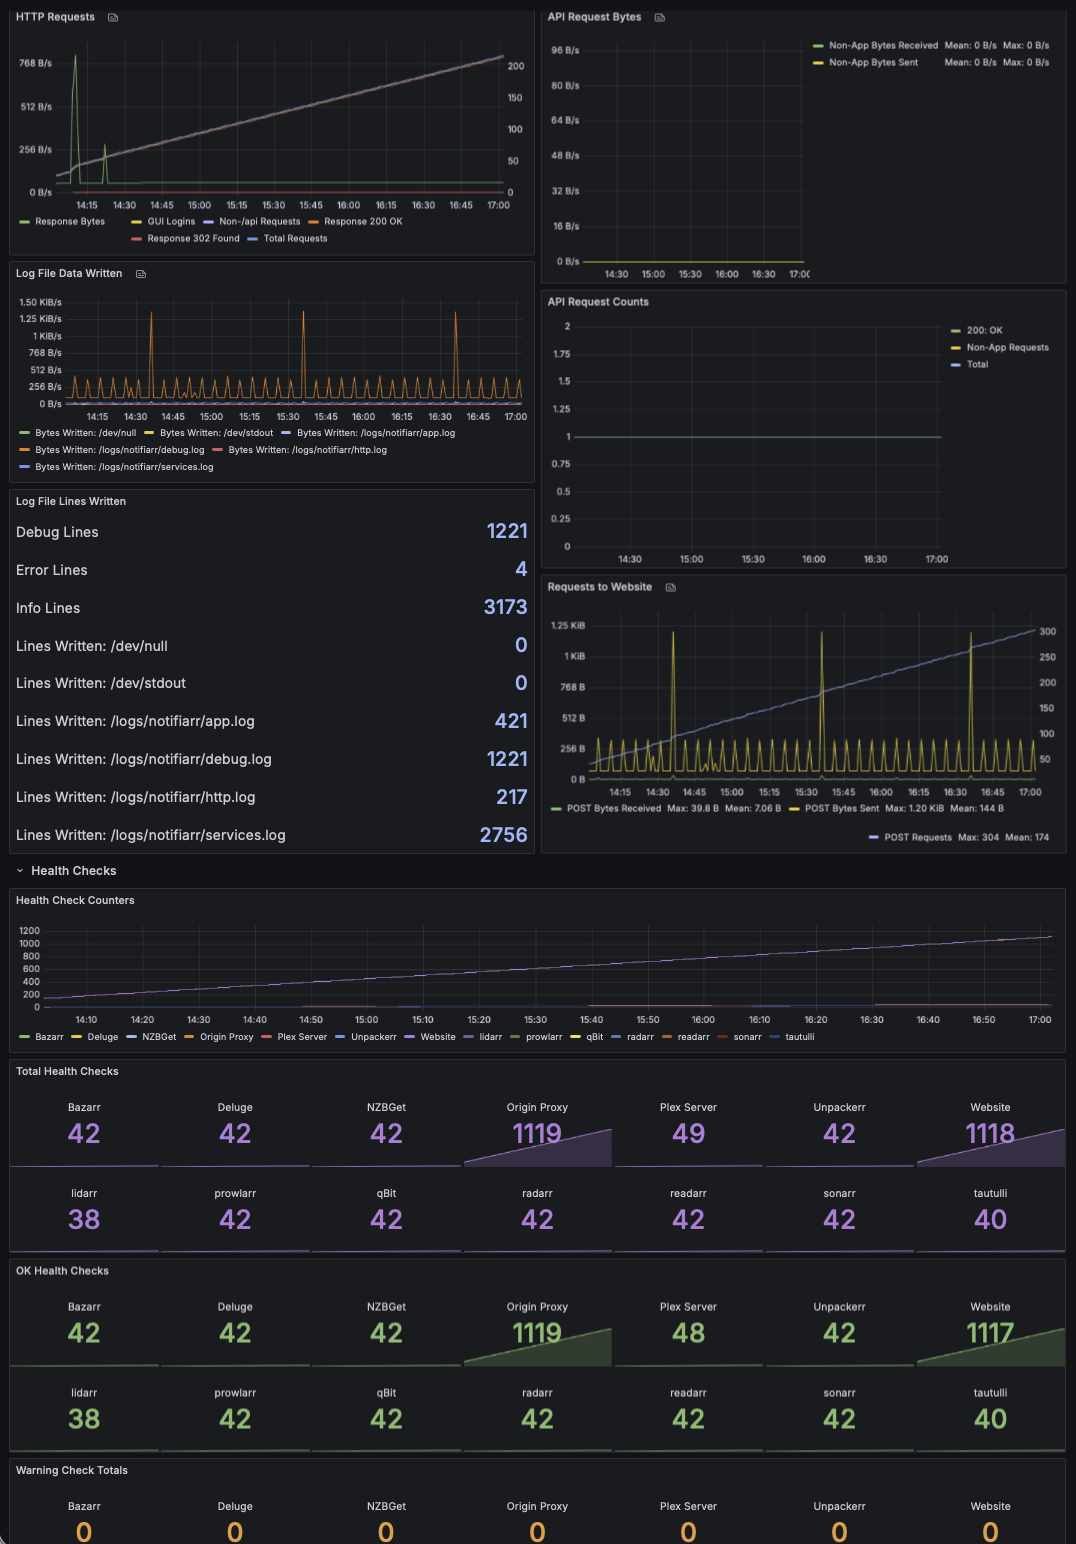
Official Notifiarr Client dashboard for Prometheus-exported metrics.
The client exports metrics for Prometheus @ /metrics and /api/metrics.
Set a custom key in the Web UI under 'Extra Keys' on the Configuration page.
Use this example scrape config to store the client's metrics in Prometheus.
Use a scrape interval of 60s.
Read more about this feature in the Notifiarr Wiki.
Data source config
Collector type:
Collector plugins:
Collector config:
Revisions
Upload an updated version of an exported dashboard.json file from Grafana
| Revision | Description | Created | |
|---|---|---|---|
| Download |