
Shopware 6 Comprehensive Business & System Health Dashboard
This dashboard is the ultimate monitoring solution for Shopware 6 merchants who need to see beyond simple "server uptime." While traditional tools tell you if your server is running, this dashboard tells you if your business is thriving and where potential bottlenecks are hidden.
Bridge the gap between technical monitoring and business intelligence.
This dashboard is the ultimate monitoring solution for Shopware 6 merchants who need to see beyond simple "server uptime." While traditional tools only tell you if your server is reachable, this dashboard provides a 360-degree view of your store's health—connecting technical performance with real-time business success.
Why this dashboard is essential for Shop Owners:
- Early Warning System for Sales: Detect anomalies in order flow or revenue immediately. If checkout issues occur, you will see the trend deviate from the norm in real-time, allowing you to react before losing significant revenue.
- Customer Journey Insights: Monitor "Open Carts" live. Visualizing current cart activity helps you gauge customer interest and identify unusual abandonment rates or technical friction during shopping.
- Multi-Channel Clarity: Stop guessing which channel performs best. With dynamic, color-coded stacked bars, you can see at a glance how your Main Shop, Amazon, eBay, or other sales channels contribute to your daily success.
- Technical Peace of Mind: The integrated "System Health" panel monitors critical parameters like PHP configurations, Message Queues, and Security Updates. A color-coded alert system (using Polystat) ensures you are the first to know when technical intervention is required.
Key Visualizations & Data Points:
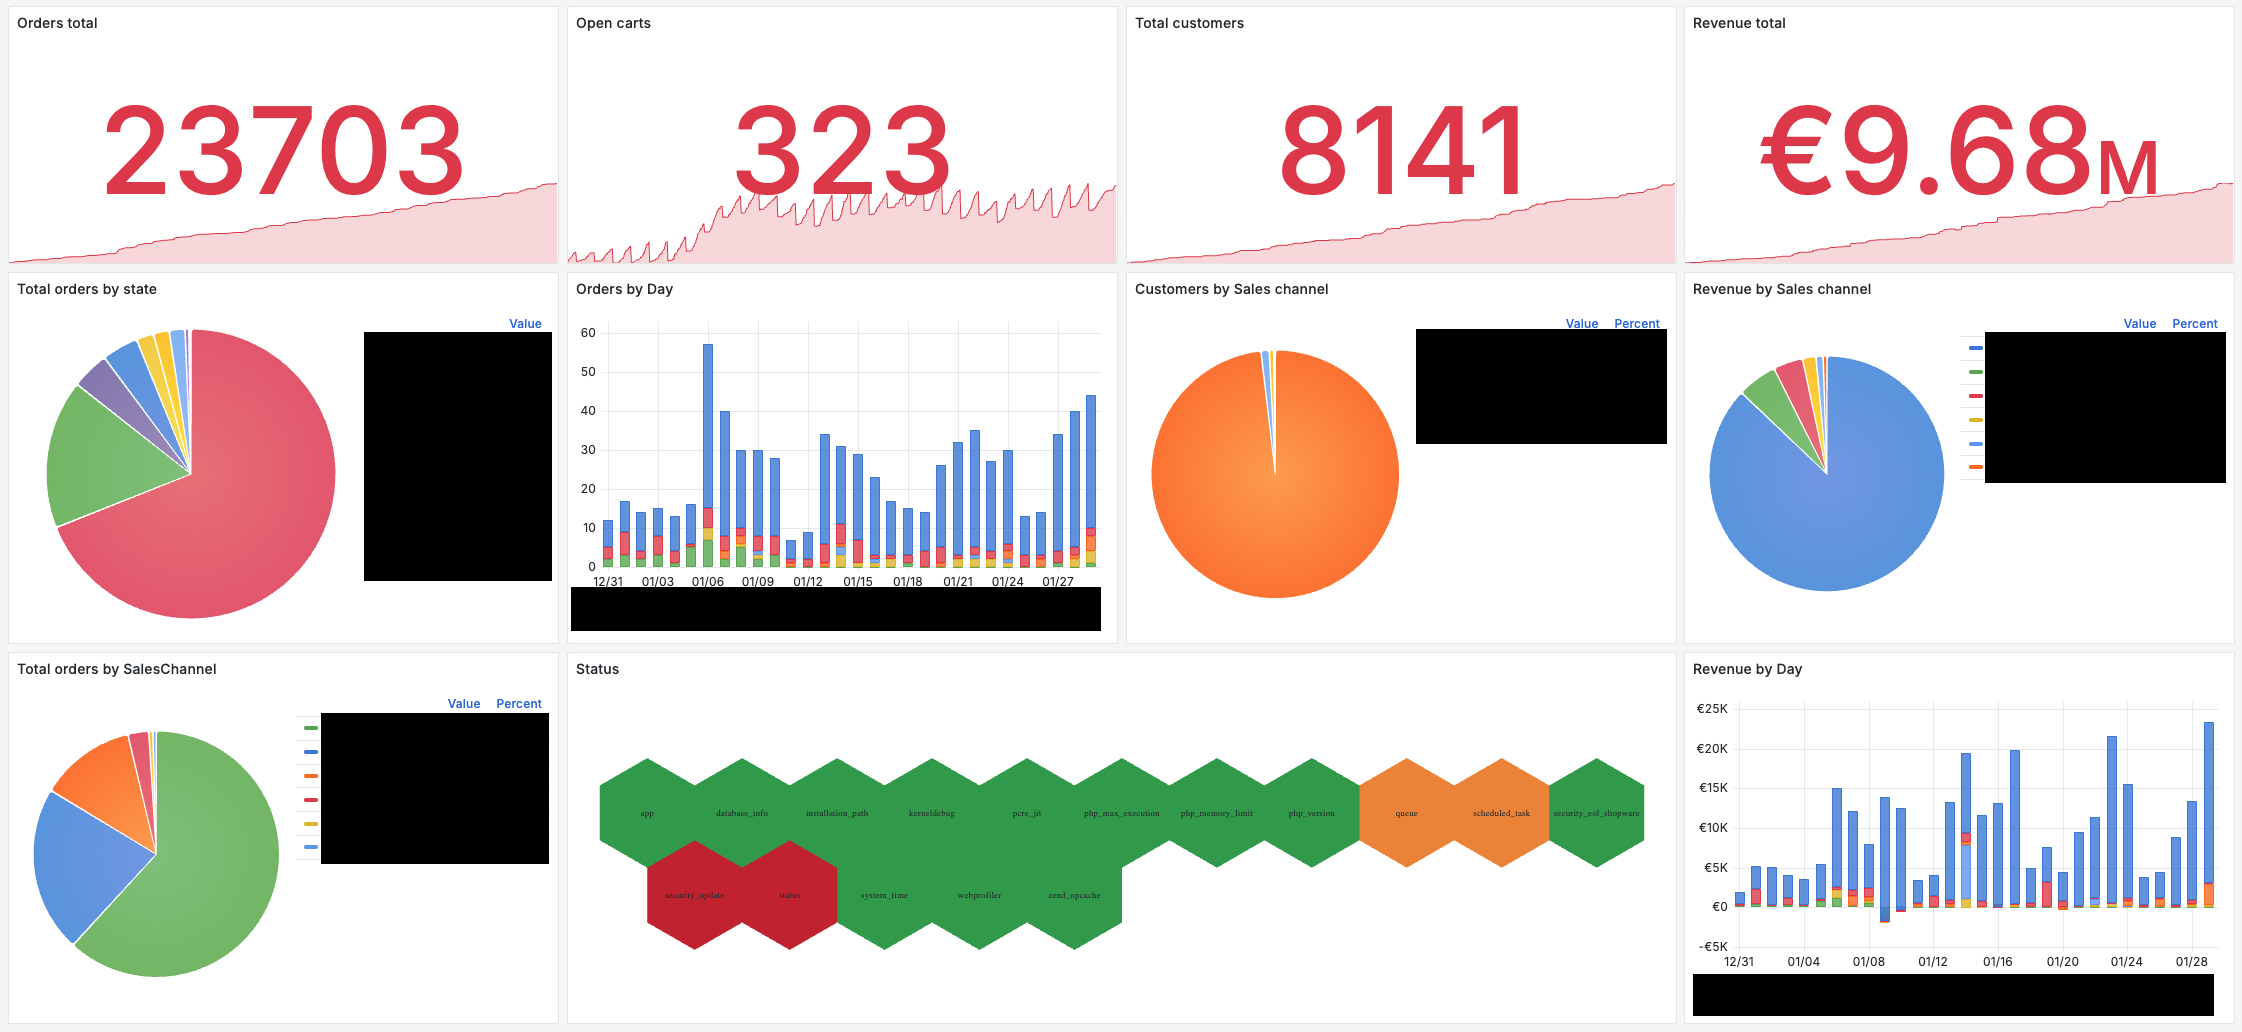
- Executive KPI Overview: High-impact counters for total orders, active carts, customer base, and net revenue.
- Operational Order Flow: Breakdown of orders by state (Open, In Progress, Delivery, etc.) to help manage warehouse workflows and customer expectations.
- Daily Sales & Revenue Trends: Visualized as stacked bars, automatically segmented by Sales Channel. This allows for instant identification of growth patterns or marketing campaign success across different markets.
- Customer & Revenue Segmentation: Detailed charts showing customer distribution and revenue share across your entire sales ecosystem.
- Proactive System Health: Real-time monitoring of App performance, Queue status, Security updates, and server environment variables.
Prerequisites & Installation
To populate this dashboard with data, you must install the corresponding Prometheus Exporter plugin in your Shopware 6 backend.
Get the required Shopware Plugin:
Installation in 6 simple steps:
- Install and activate the plugin in your Shopware 6 administration.
- Go to Settings > System > Users & Permissions > Roles in the Shopware 6 administration. Click New role, enter a name like “Metrics” and choose the Permission Ujamii Metrics which you can find all the way down. (Official documentation)
- Add an integration in your Shopware backend: Go to Settings > System > Integrations, click Add integration and choose the new role for it. After creation you will see the Client-ID and the Client-Secret. Make sure to write down the Client-Secret. You won’t be able to access it after the page has closed. (Official documentation)
- Add a new prometheus job (Official documentation):
- job_name: 'shopware'
    metrics_path: '/api/_action/ujamii/metrics'
    params:
      format: [prometheus]
    scrape_interval: 1m
    scheme: https
    oauth2:
      client_id: 'CLIENT_ID'
      client_secret: 'CLIENT_SECRET'
      token_url: 'https://www.your-shop.tld/api/oauth/token'
      scopes:
        - 'write'
    static_configs:
      - targets: ['www.your-shop.tld']
        labels:
          host: 'your-shop-name'
- Add your Prometheus endpoint as a data source in Grafana if you have not done it yet
- Import this Dashboard JSON and select your Prometheus data source.
Too technical for you? Just contact us, we can help you with your installation.
Technical Specifications
- Data Source: Prometheus
- Platform: Optimized for Shopware 6
- Visualization Requirements: Requires the Polystat panel plugin for the System Health section.
- Dynamic Scaling: Features a dynamic
$shopvariable, allowing you to switch between multiple shop instances or environments within a single dashboard.
Designed for Shopware merchants who want to stop searching for data and start making data-driven decisions.
Data source config
Collector config:
Upload an updated version of an exported dashboard.json file from Grafana
| Revision | Description | Created | |
|---|---|---|---|
| Download |