
Aidbox
Monitor Aidbox API performance, workload, database activity, and resource usage in production.
Aidbox Observability Dashboard
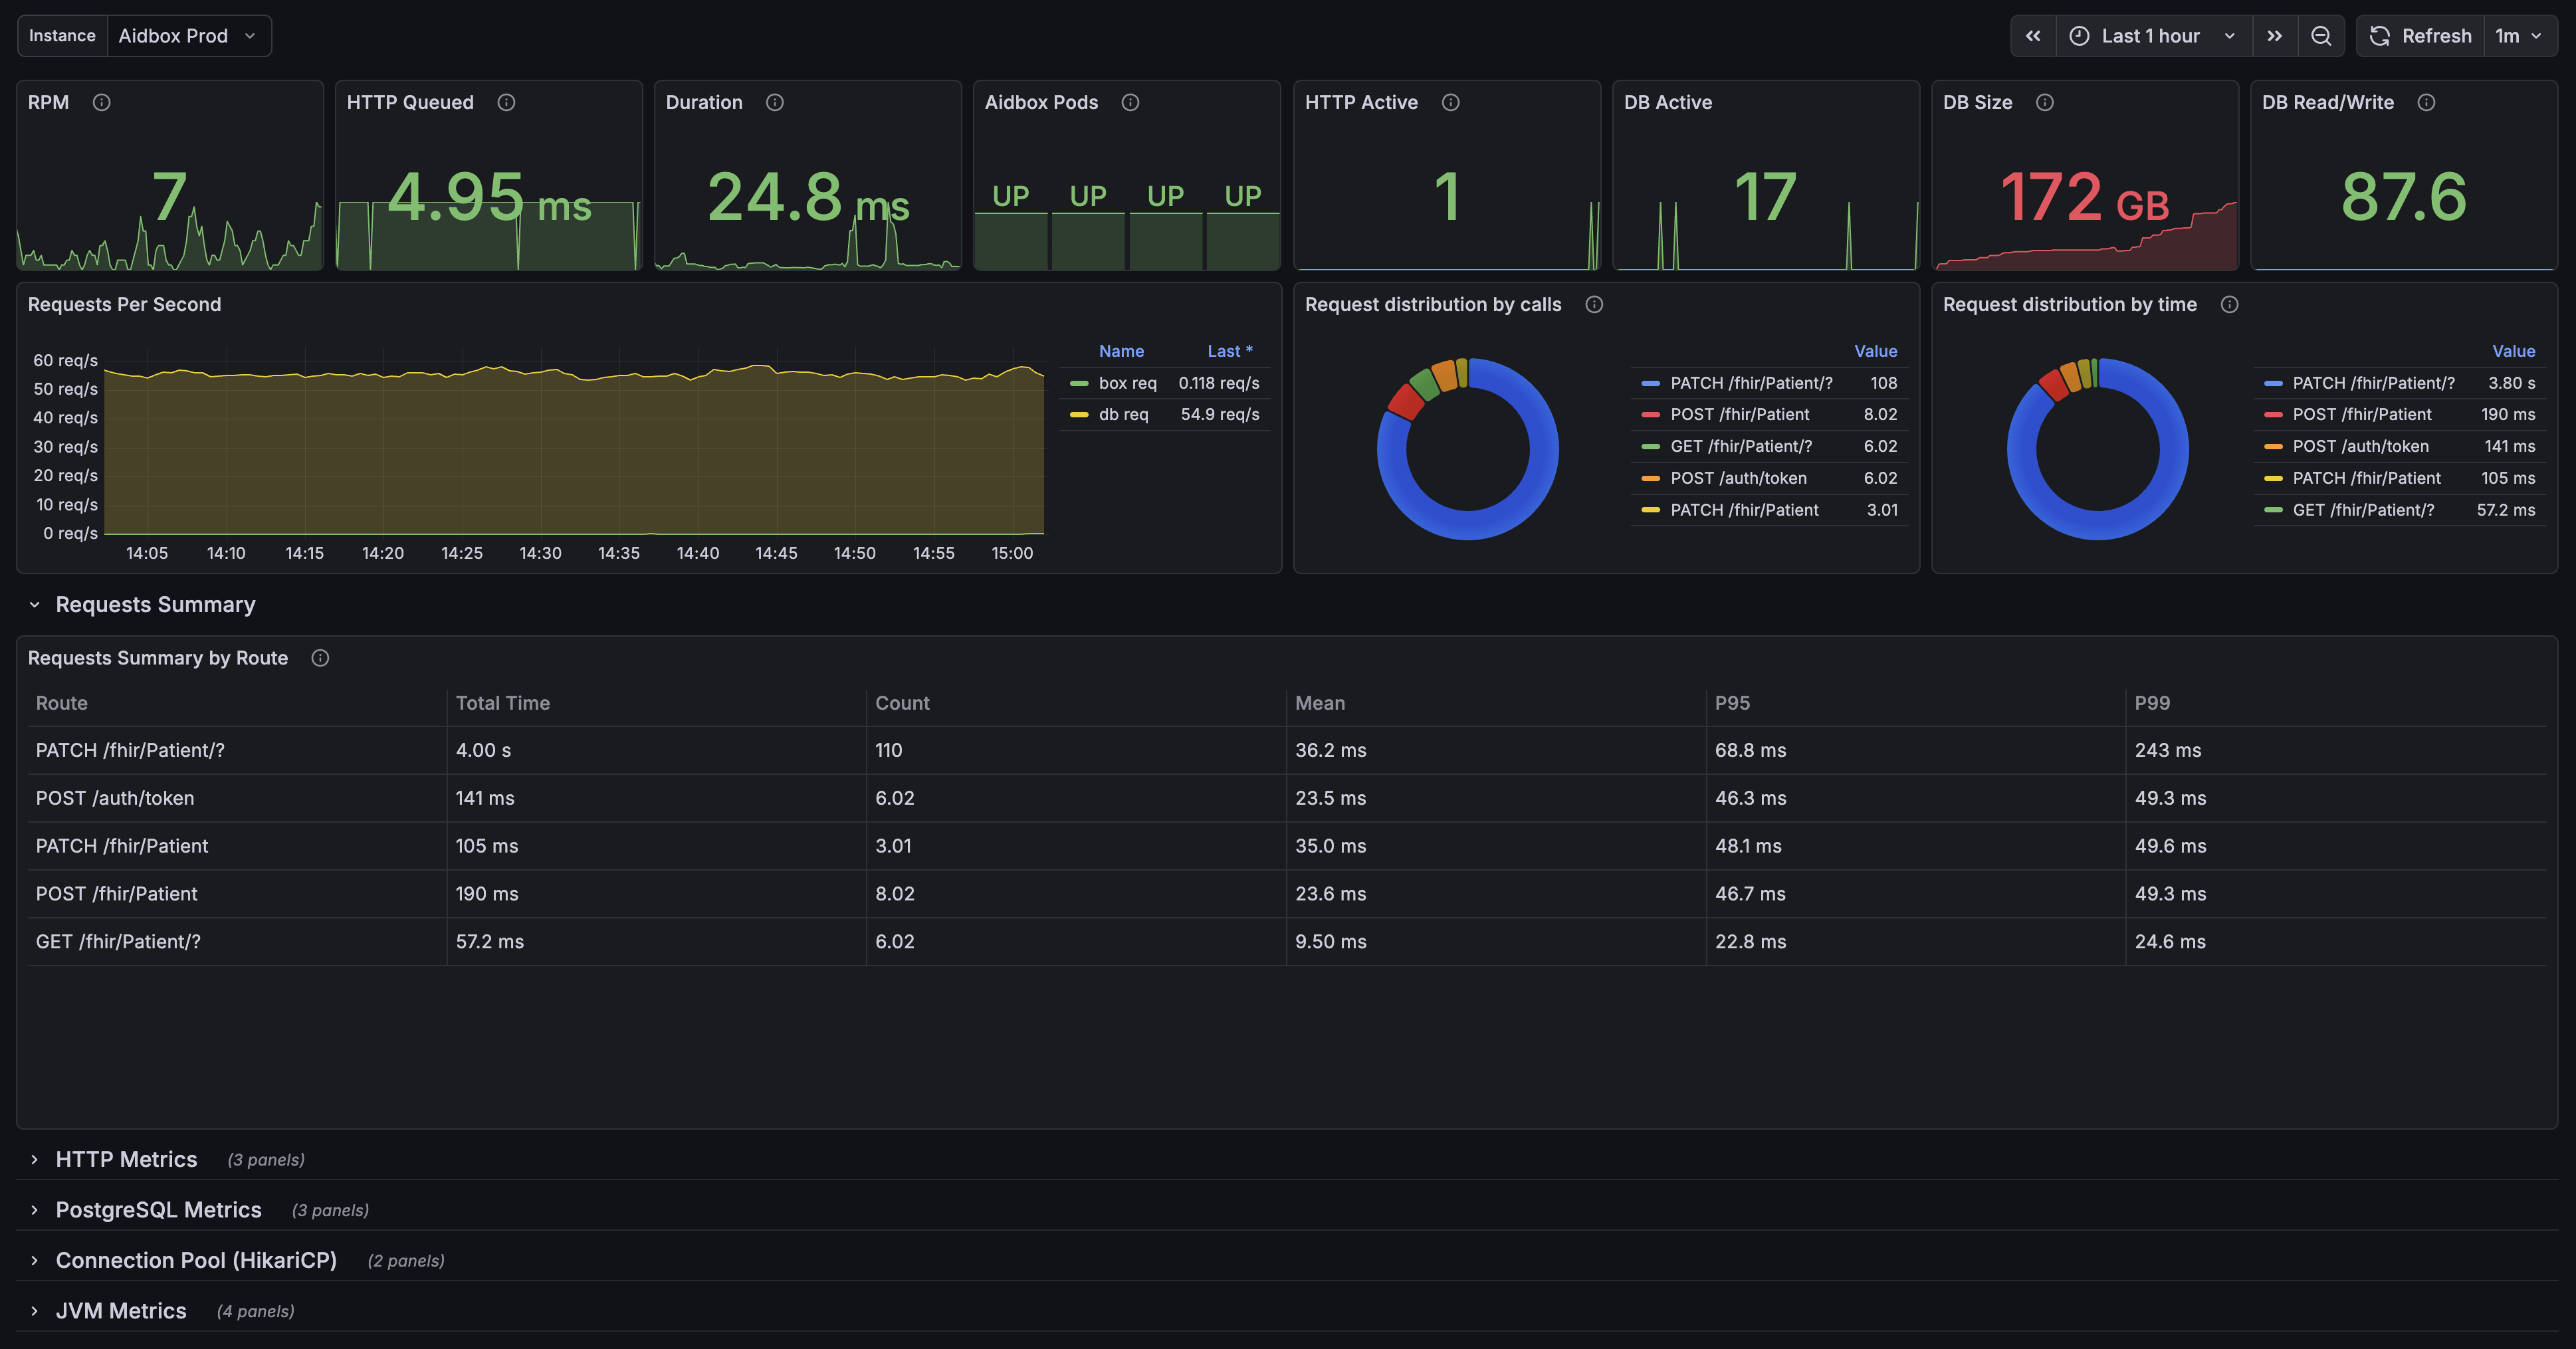
This Grafana dashboard provides essential visibility into Aidbox performance and health. It helps operators monitor API behavior, application workload, database activity, and infrastructure resource usage in one place.
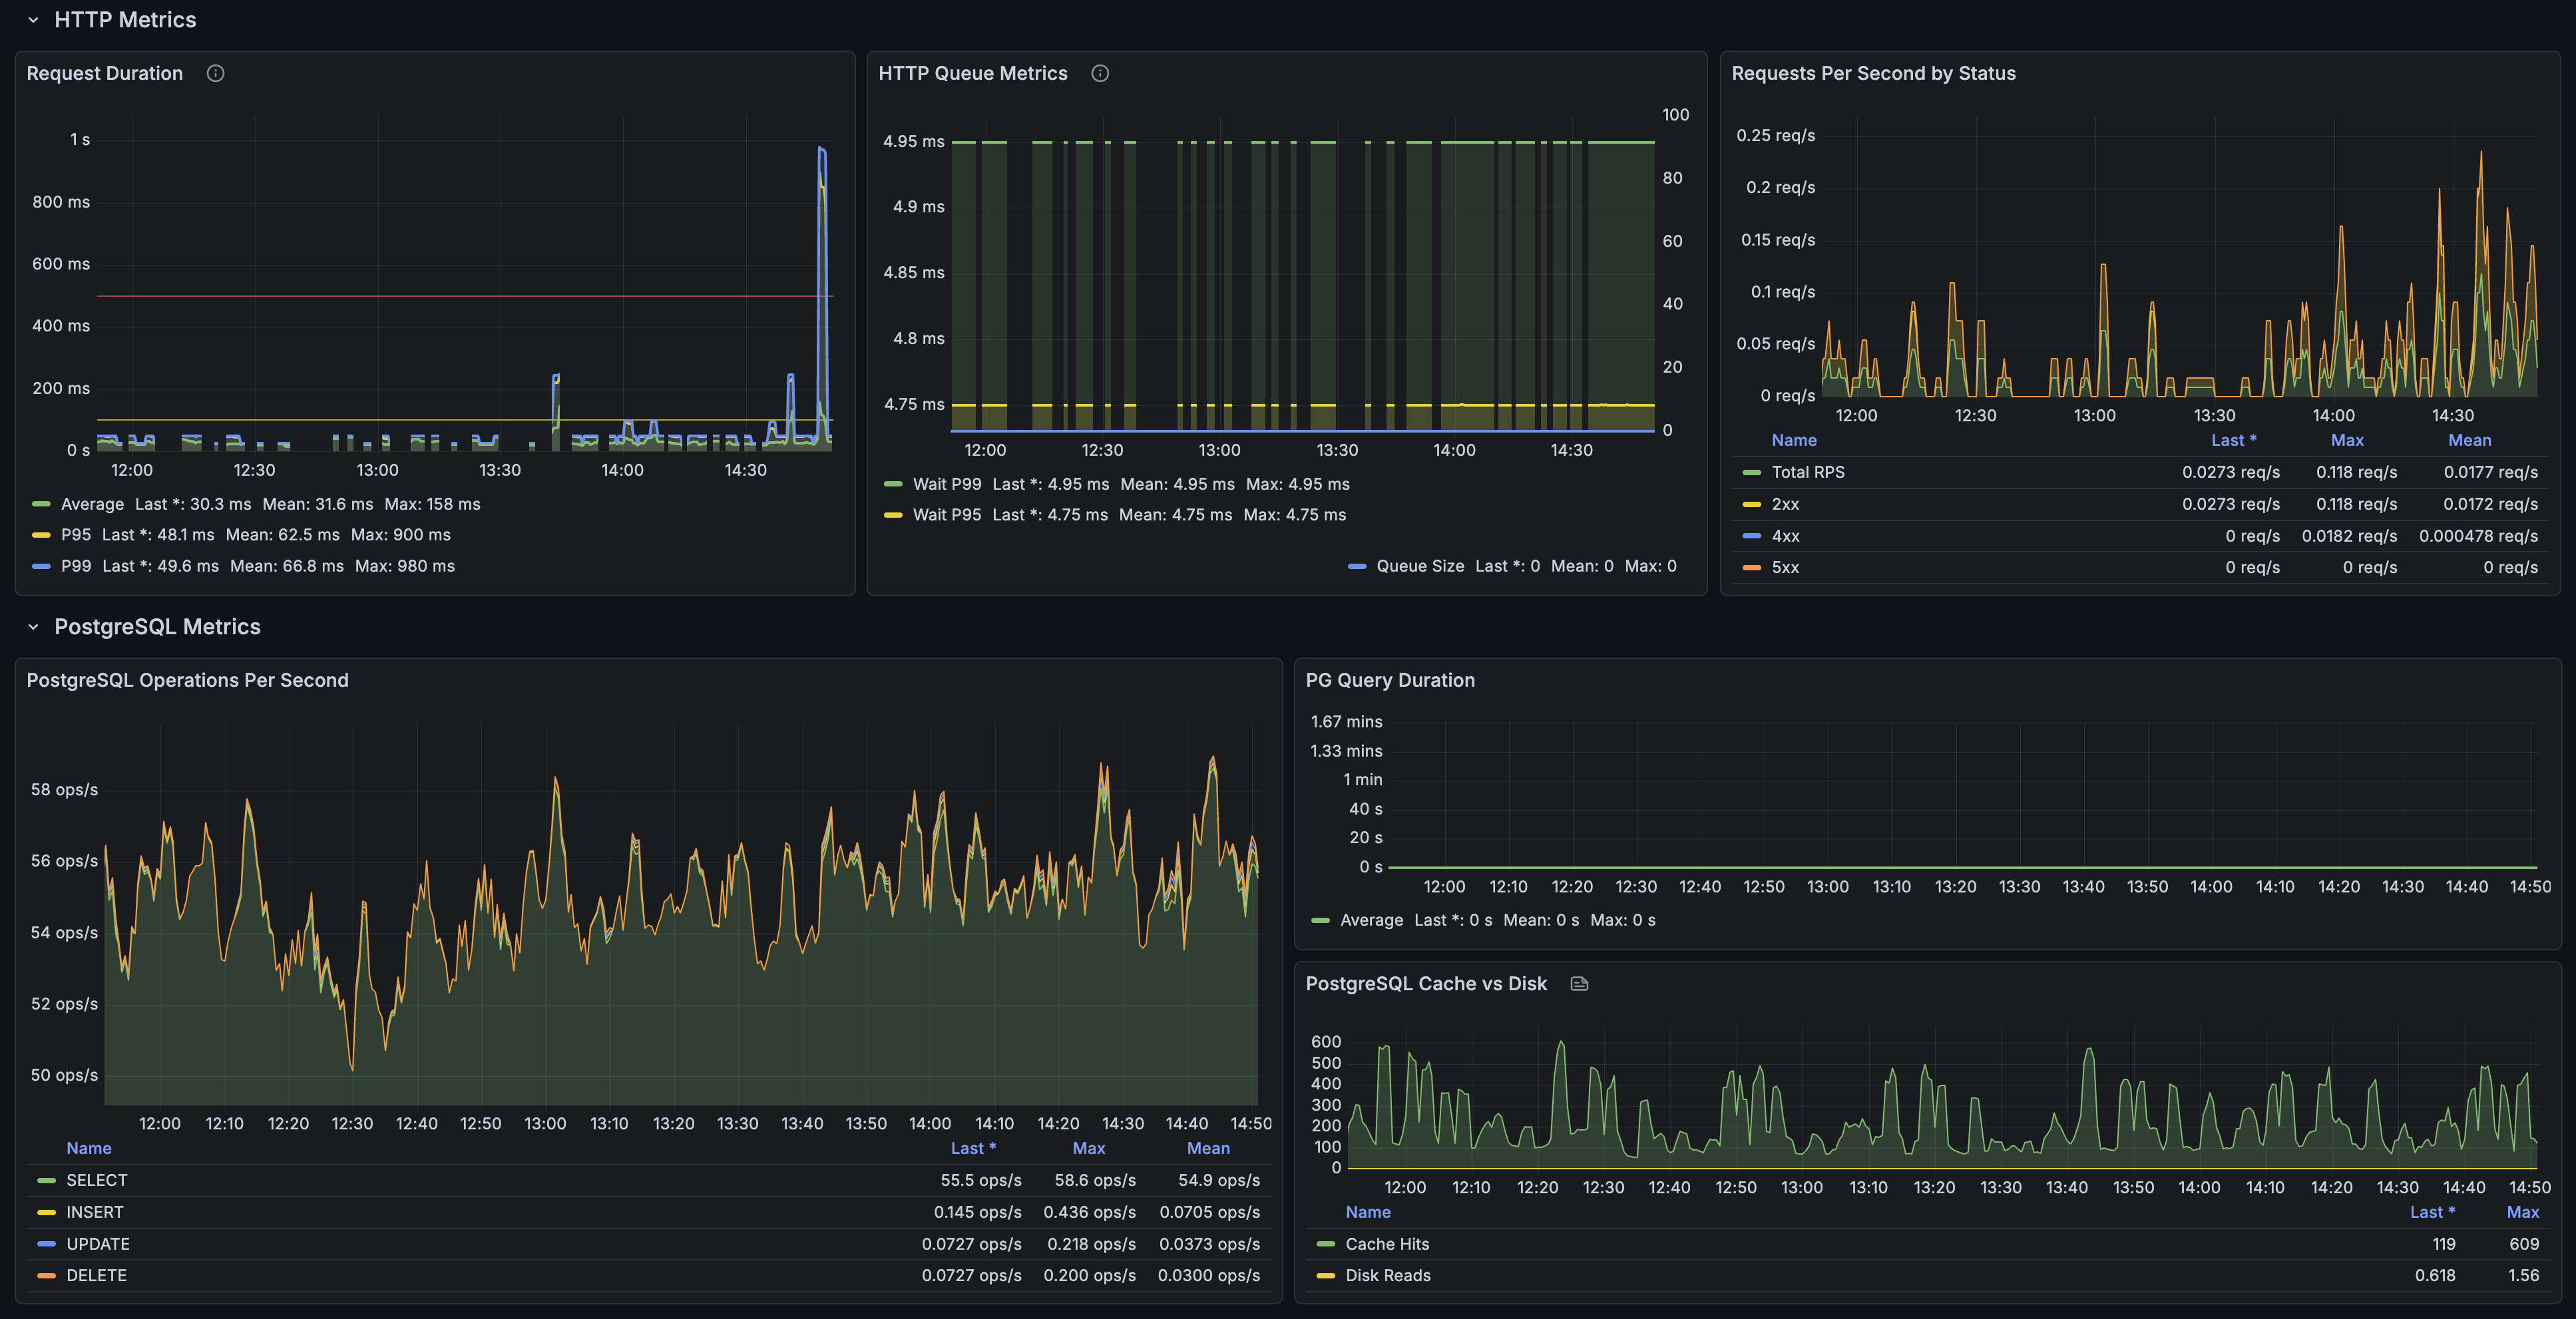
Key views include request rate and latency, error codes, internal processing metrics, PostgreSQL signals, and CPU/memory utilization. The dashboard is designed for production monitoring, troubleshooting, and capacity planning.
It works with standard Prometheus metrics exposed by Aidbox and common Kubernetes/PostgreSQL exporters and can be easily customized for different deployment setups.
Best suited for: DevOps, SREs, and platform teams running Aidbox in production.
Data source config
Collector config:
Upload an updated version of an exported dashboard.json file from Grafana
| Revision | Description | Created | |
|---|---|---|---|
| Download |