
Restate: Overview
High-level cluster health and performance monitoring for Restate Server
Official monitoring dashboard for Restate - the platform for building resilient applications with durable execution.
Overview
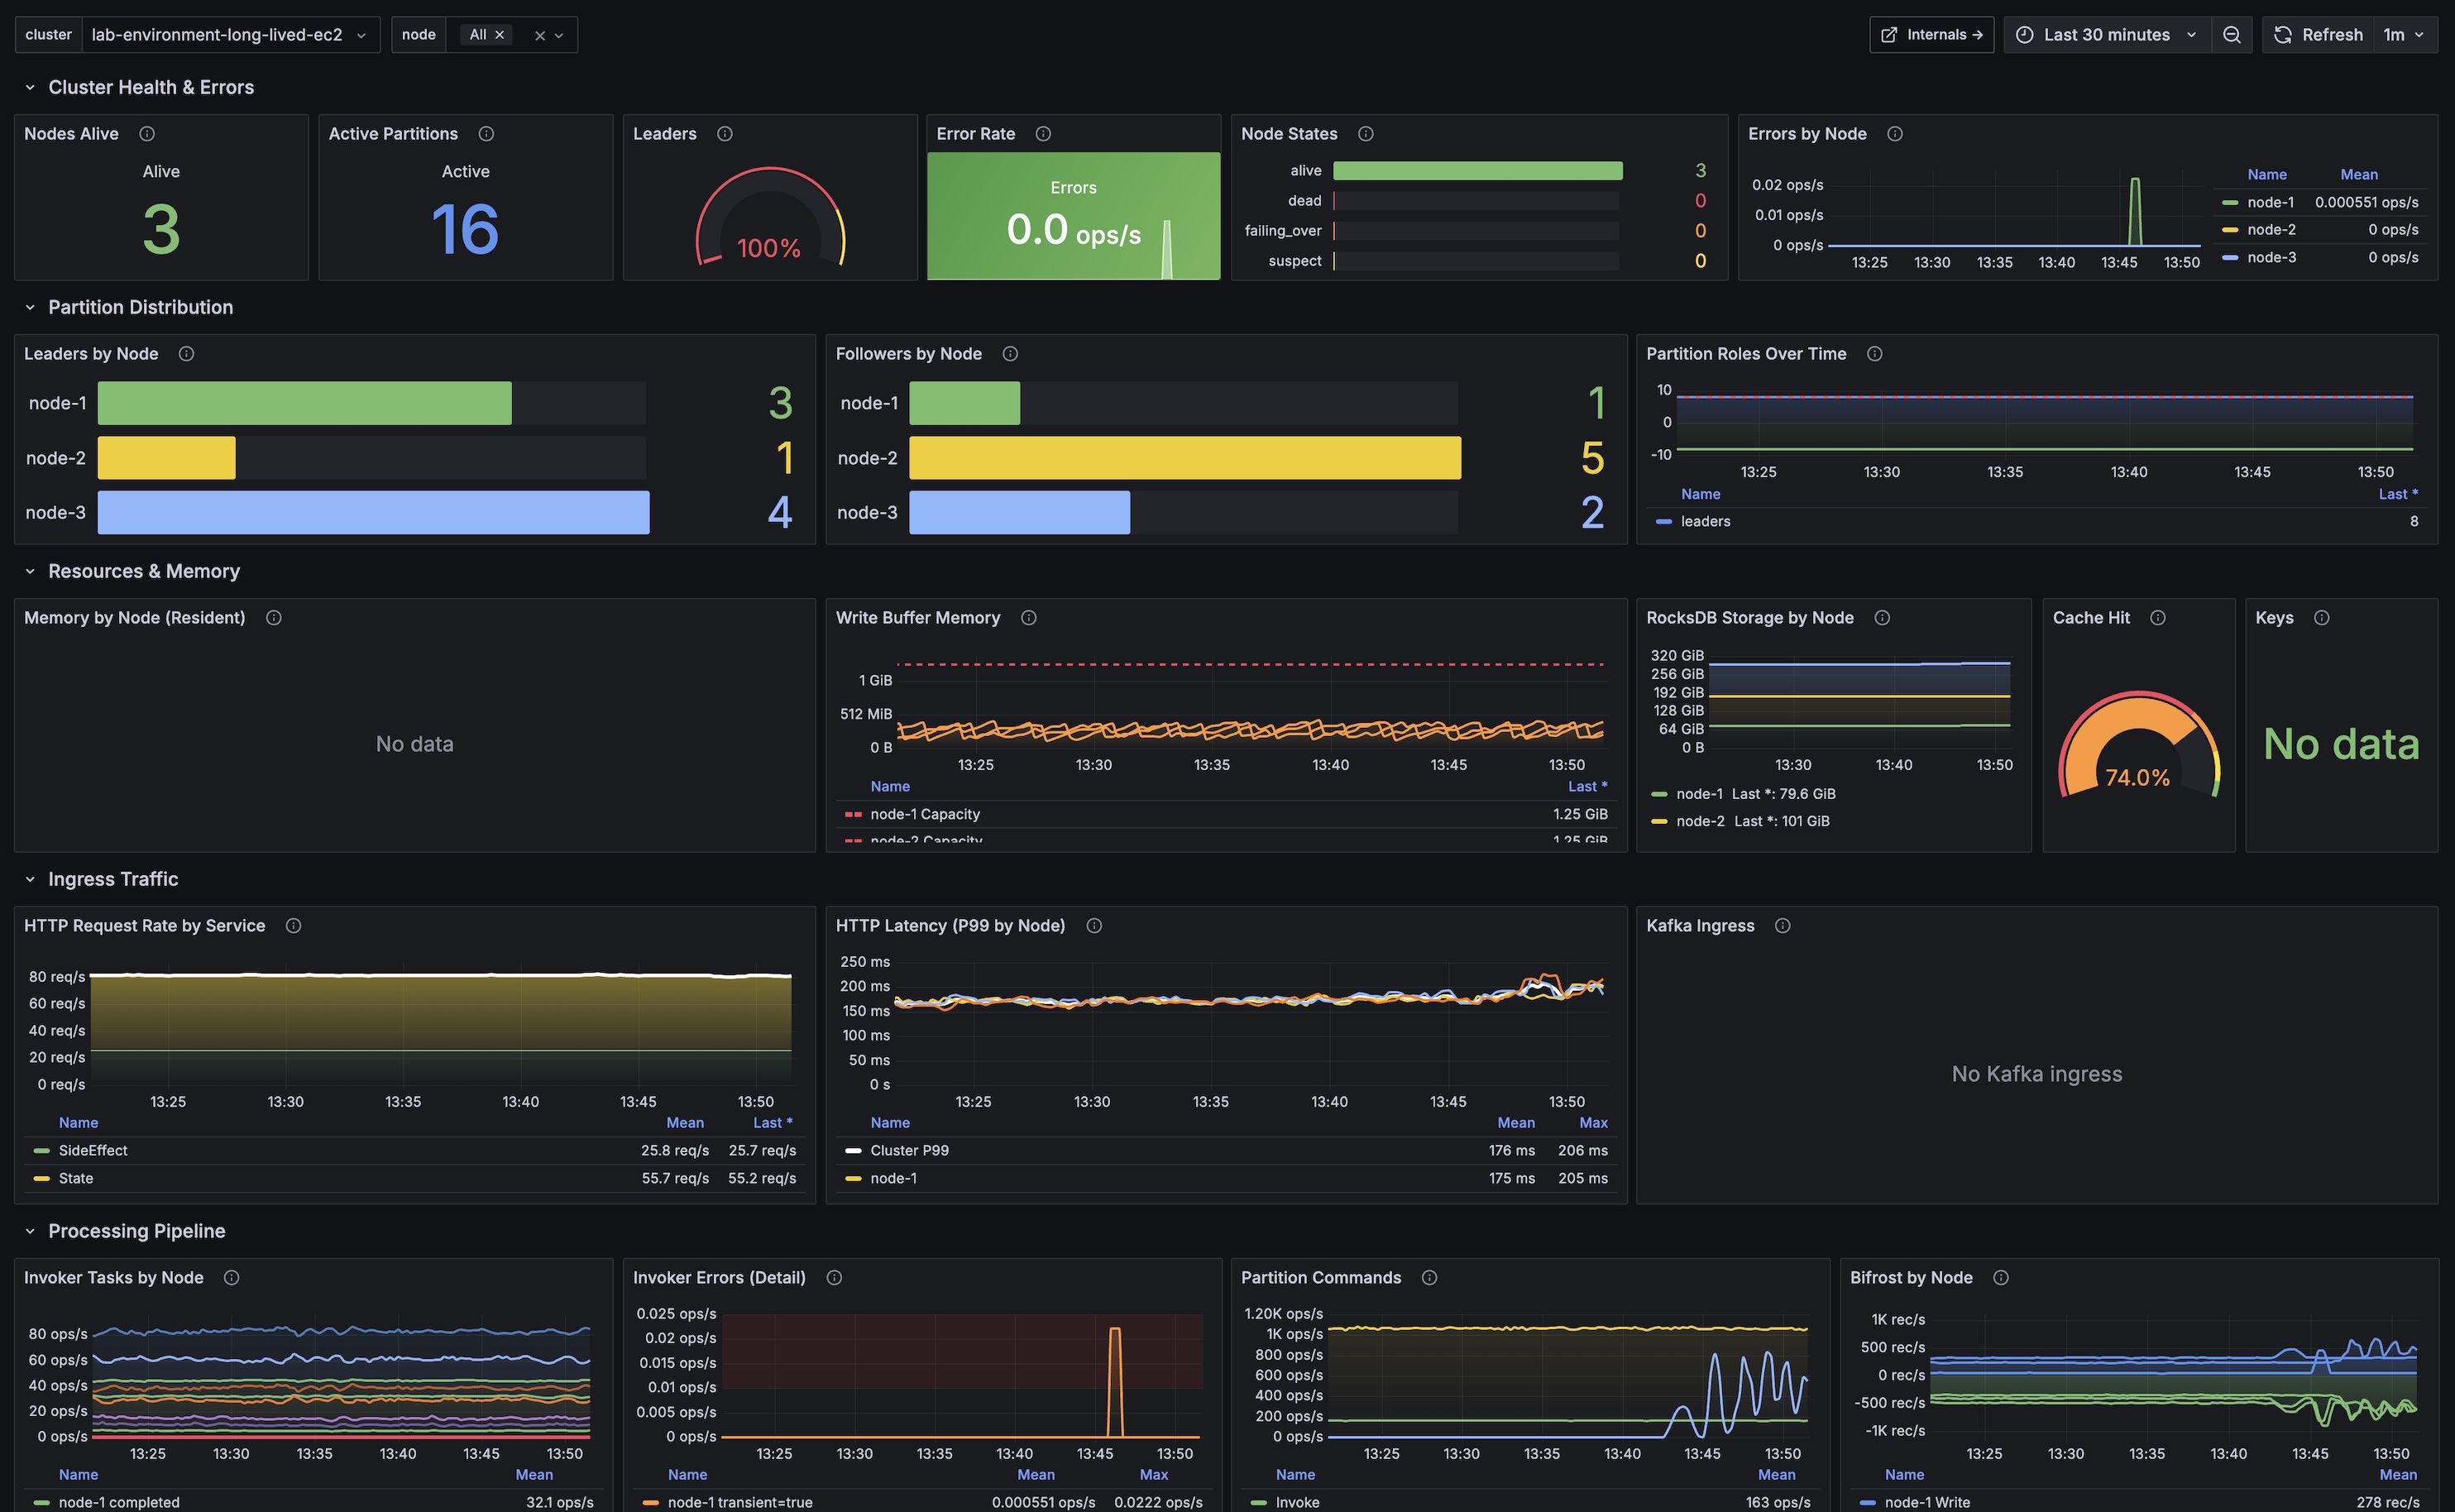
This dashboard provides high-level cluster health and performance monitoring for Restate Server deployments. It's designed for both single-node and multi-node clusters, with per-node breakdowns to quickly identify issues.
Sections
- Cluster Health & Errors - Node count, partition status, leader distribution, and error rates
- Partition Distribution - Leaders and followers per node, partition role changes over time
- Resources & Memory - JEMalloc resident memory, RocksDB write buffer usage, storage size, and cache hit rate
- Ingress Traffic - HTTP request rate by service, P99 latency per node, Kafka consumer metrics
- Processing Pipeline - Invoker task throughput, error breakdown, partition commands, Bifrost log I/O
Requirements
- Restate Server exposing metrics on
/metrics(default port 5122) - Prometheus scraping Restate metrics
Related Dashboard
For deep-dive troubleshooting, use the companion Restate: Internals dashboard which covers Bifrost, RocksDB, Partition Processor, and Metadata Server internals in detail.
Links
Data source config
Collector type:
Collector plugins:
Collector config:
Revisions
Upload an updated version of an exported dashboard.json file from Grafana
| Revision | Description | Created | |
|---|---|---|---|
| Download |