
OpenAI Codex (VictoriaStack)
Dashboard for OpenAI Codex CLI with information about token usage and token cache, reasoning effort, tools usage stats and latency, mcp servers stats, API requests and errors, etc...
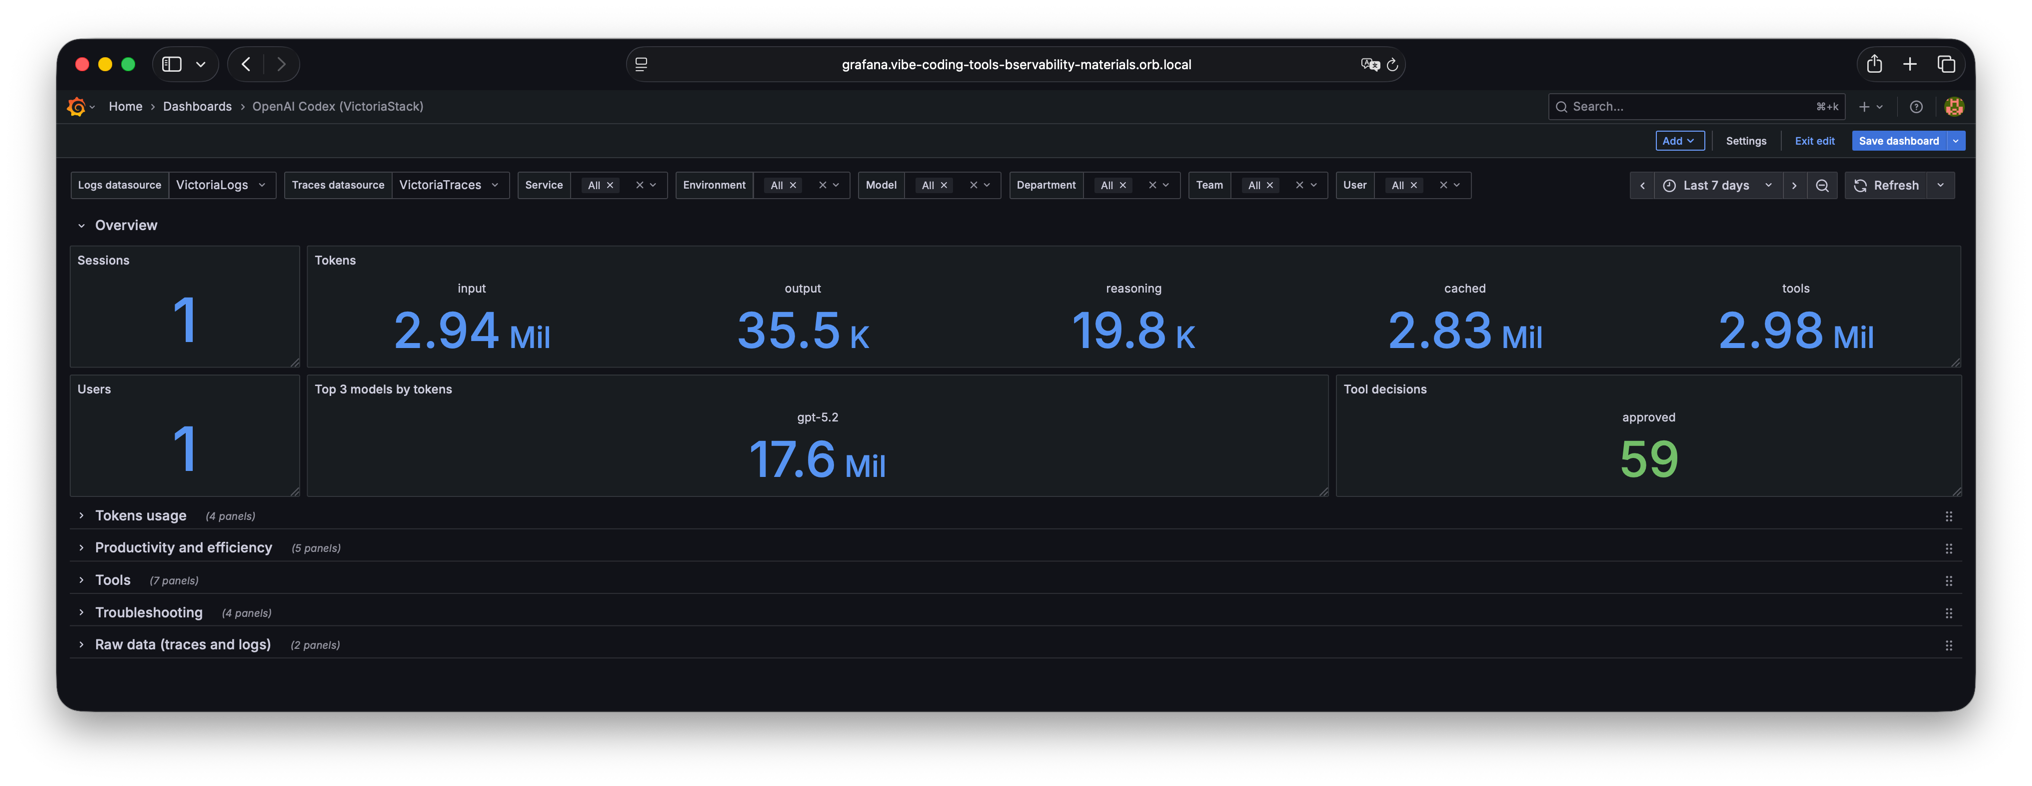
The OpenAI Codex (VictoriaStack) dashboard uses the jaeger, victoriametrics-logs-datasource and victoriametrics-metrics-datasource data sources to create a Grafana dashboard with the barchart, bargauge, logs, stat, table and timeseries panels.
Data source config
Collector type:
Collector plugins:
Collector config:
Revisions
Upload an updated version of an exported dashboard.json file from Grafana
| Revision | Description | Created | |
|---|---|---|---|
| Download |
OpenAI
Easily monitor OpenAI API usage with Grafana Cloud's out-of-the-box monitoring solution.
Learn more