
EXAScaler – SFA Stats (Single Appliance)
Provides comprehensive performance monitoring for an individual DDN SFA storage appliance. This dashboard presents detailed metrics for Virtual Disks (VD) and Physical Disks (PD), including throughput, IOPS, read/write latency, and IO size distribution histograms. Additional panels display per-controller (C0/C1) throughput and IOPS breakdowns for granular performance analysis.
SFA Stats (Single Appliance)
The SFA Single Appliance dashboard provides detailed, real-time monitoring for an individual DDN SFA storage appliance. It visualizes Virtual Disk (VD) and Physical Disk (PD) performance including throughput, IOPS, latency heatmaps, and IO size distribution. This dashboard helps administrators identify disk-level bottlenecks, performance imbalances, and latency outliers within a single appliance.
What This Dashboard Shows
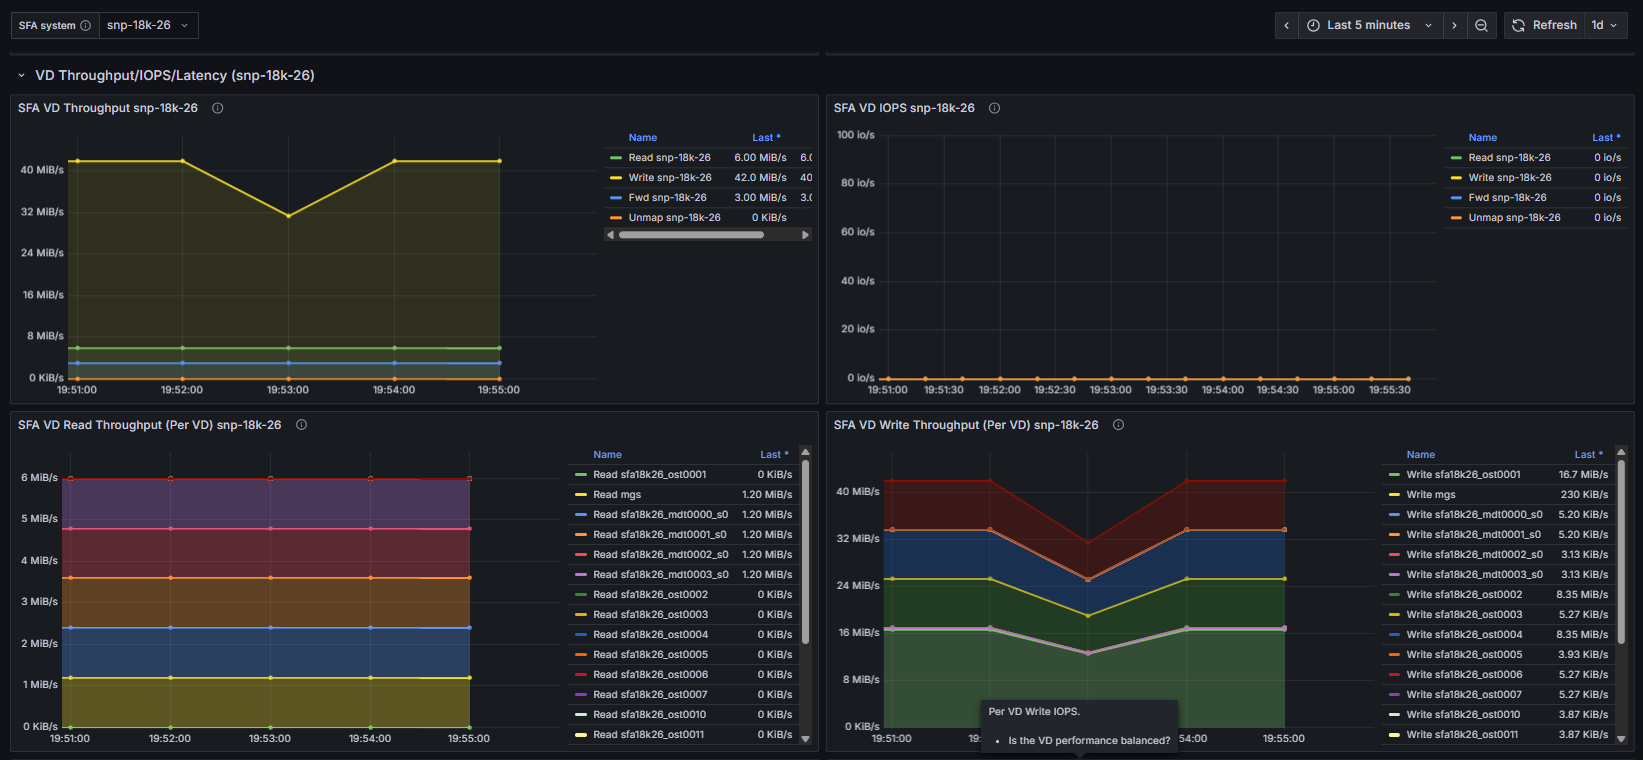
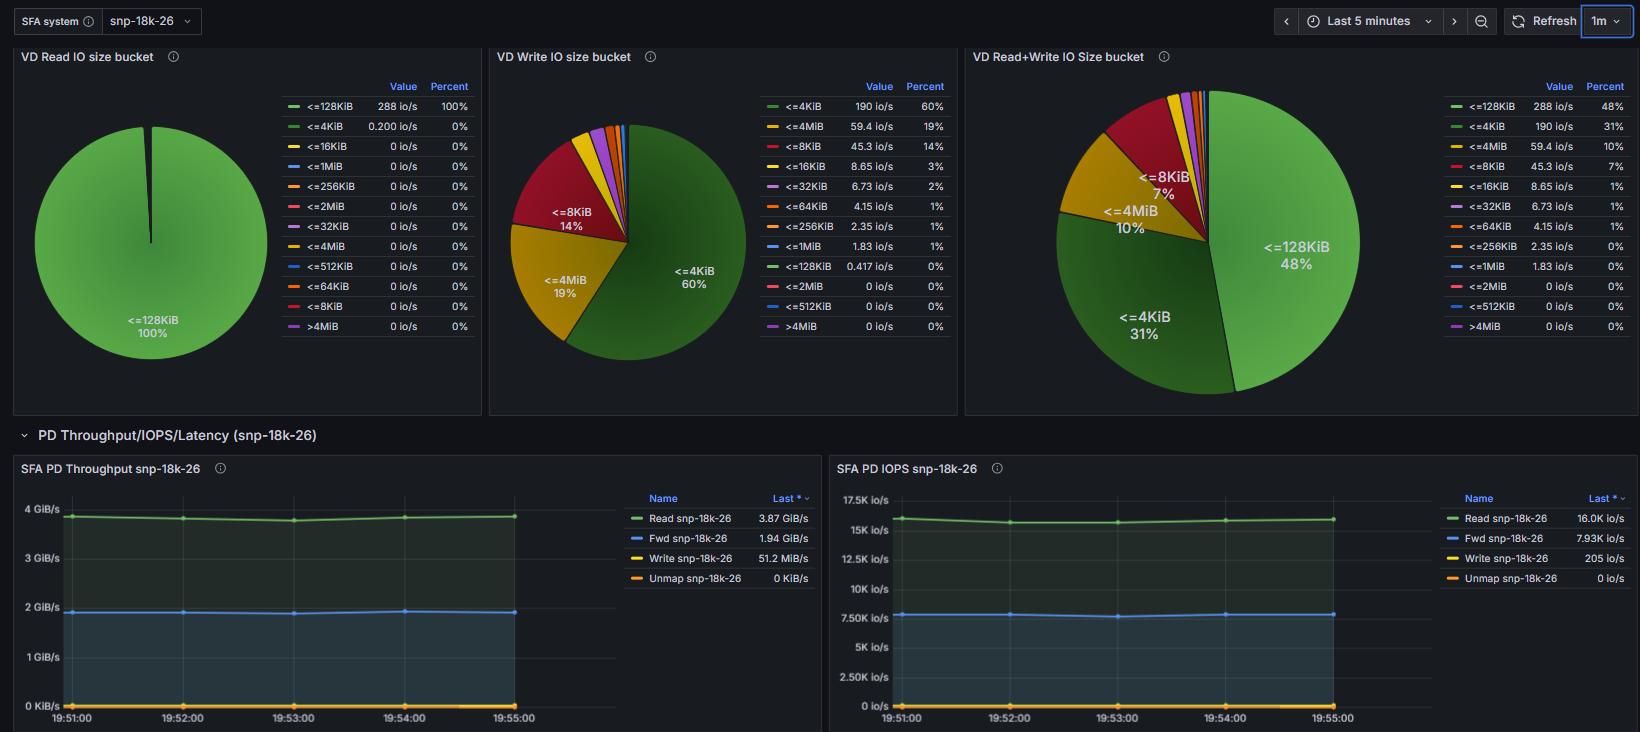
VD Throughput/IOPS/Latency
Panels derived from SFA exporter metrics:
- Aggregate VD Throughput (Read/Write/Fwd/Unmap)
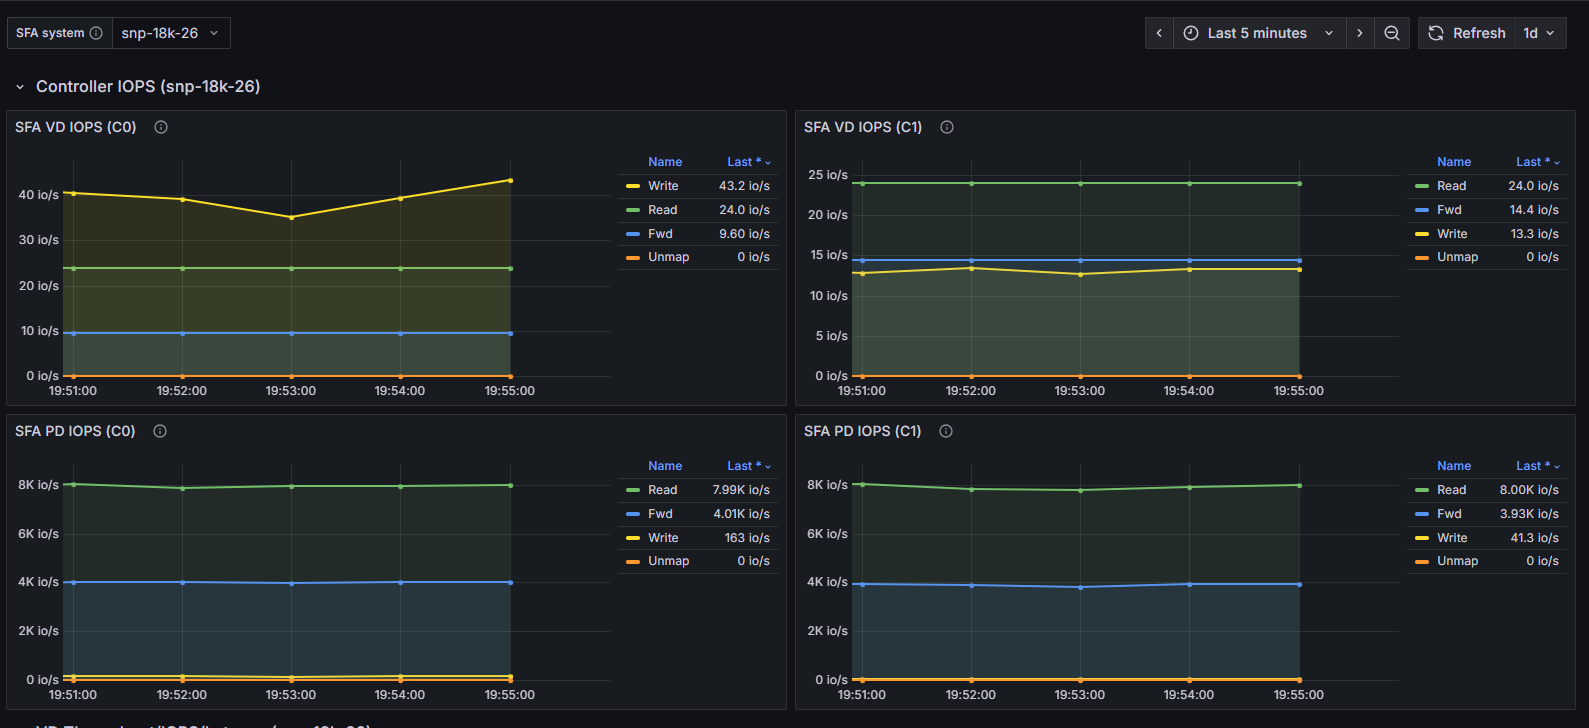
- Aggregate VD IOPS
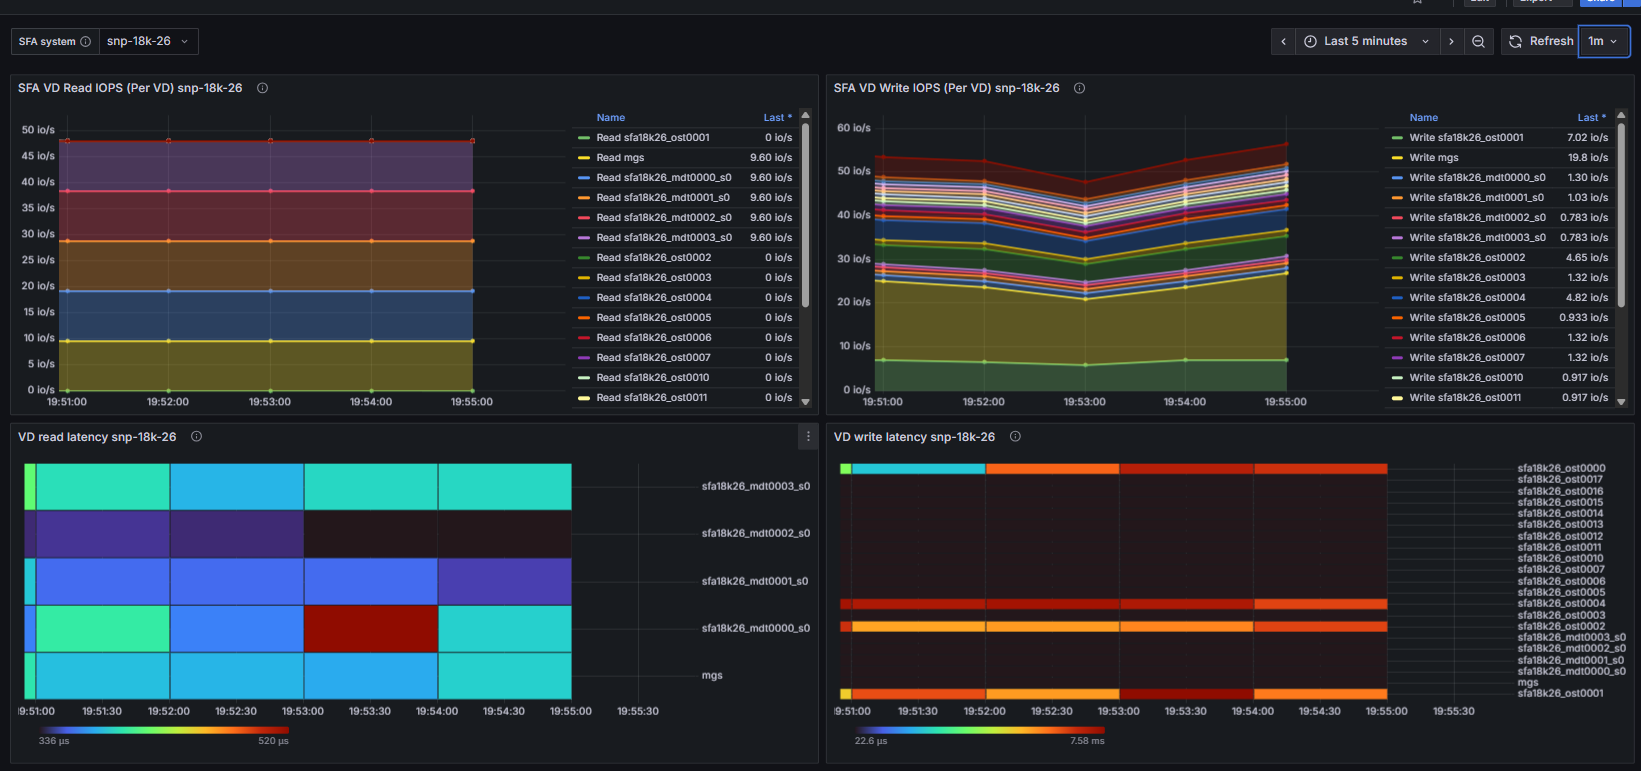
- Per-VD Read/Write Throughput and IOPS (stacked for balance analysis)
- VD Read/Write Latency Heatmaps (outlier detection)
- VD IO Size Distribution (Read/Write/Combined pie charts)
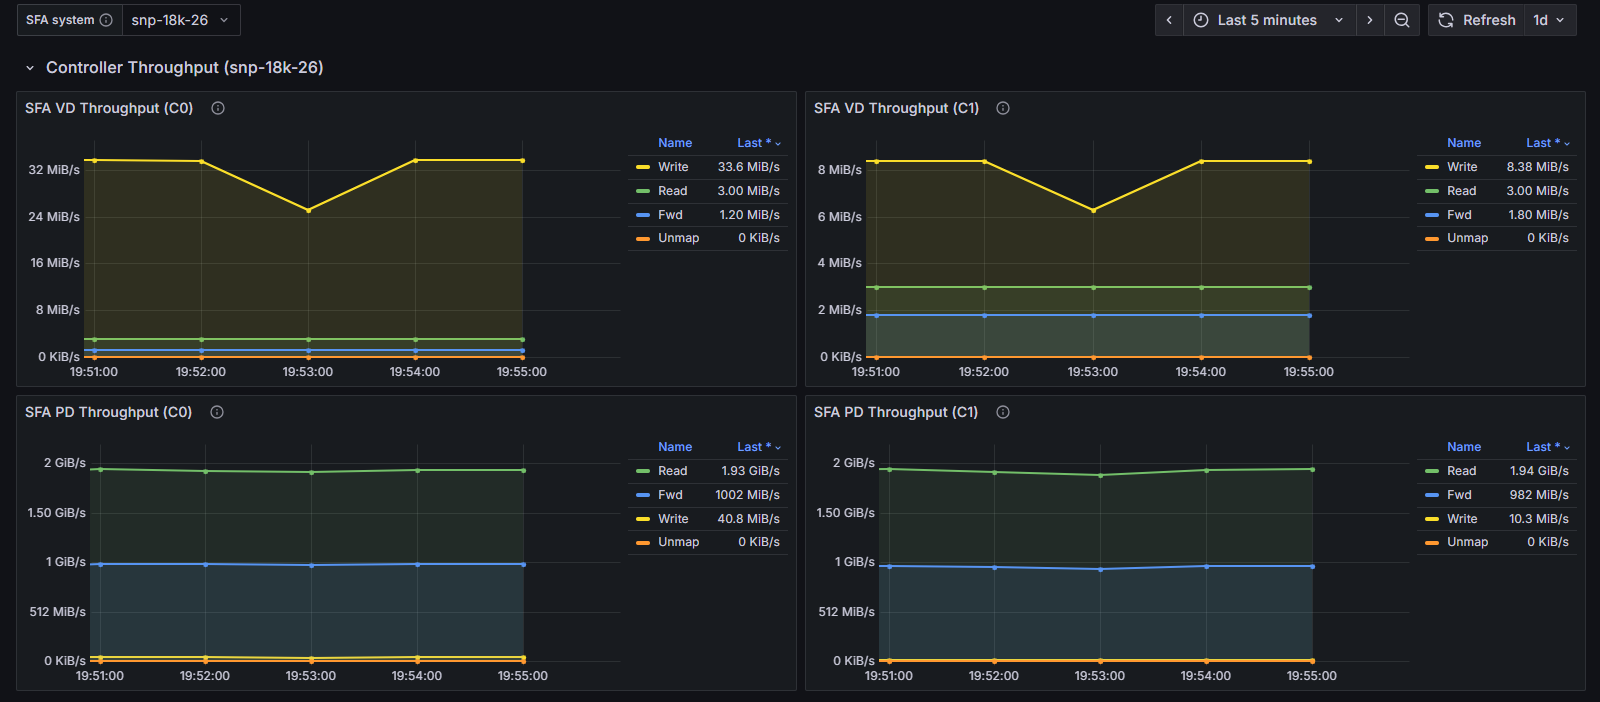
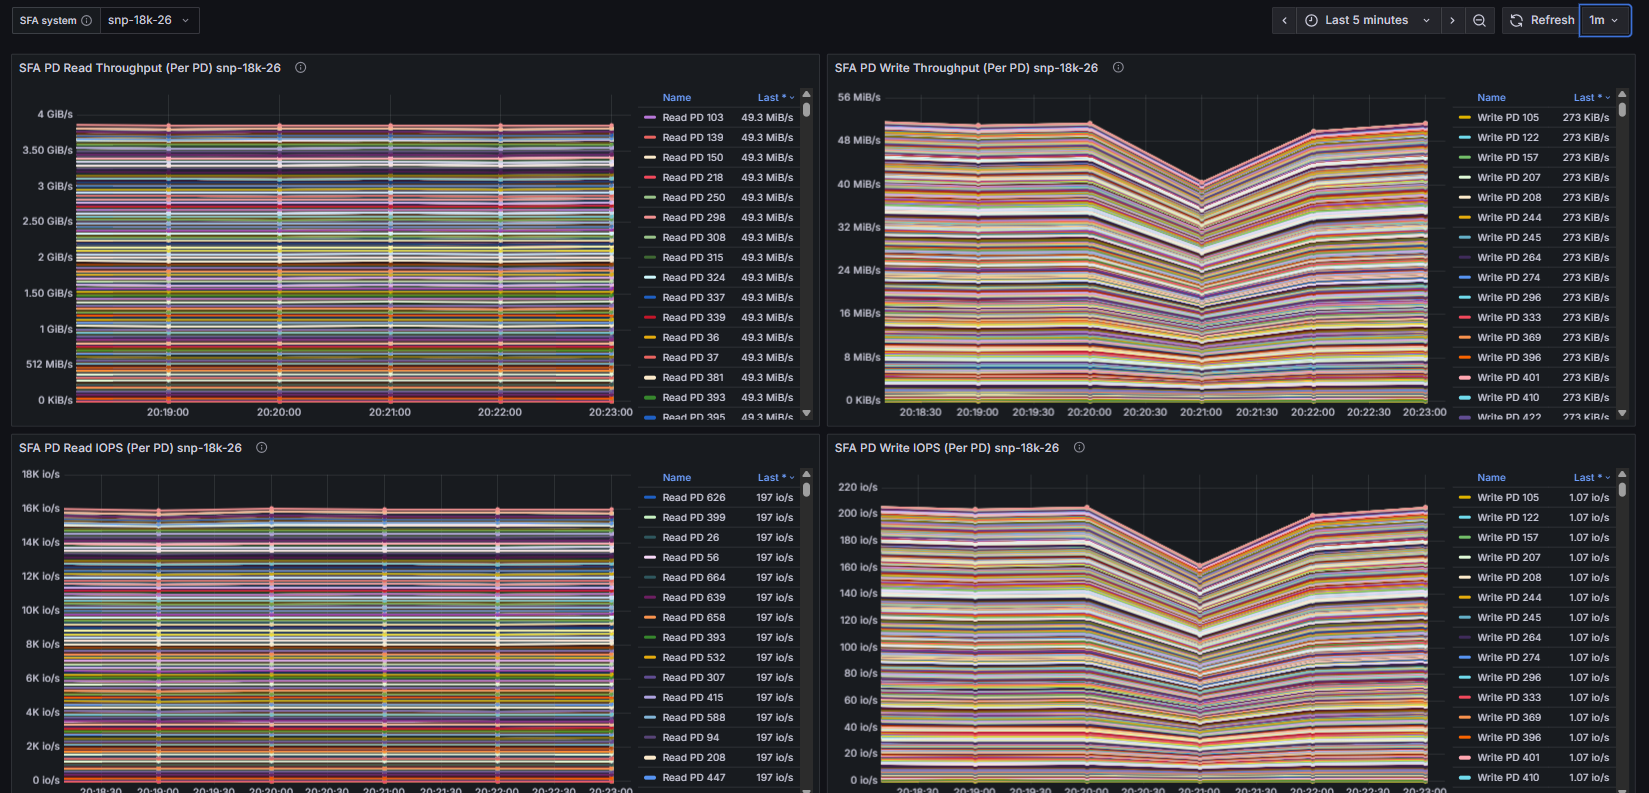
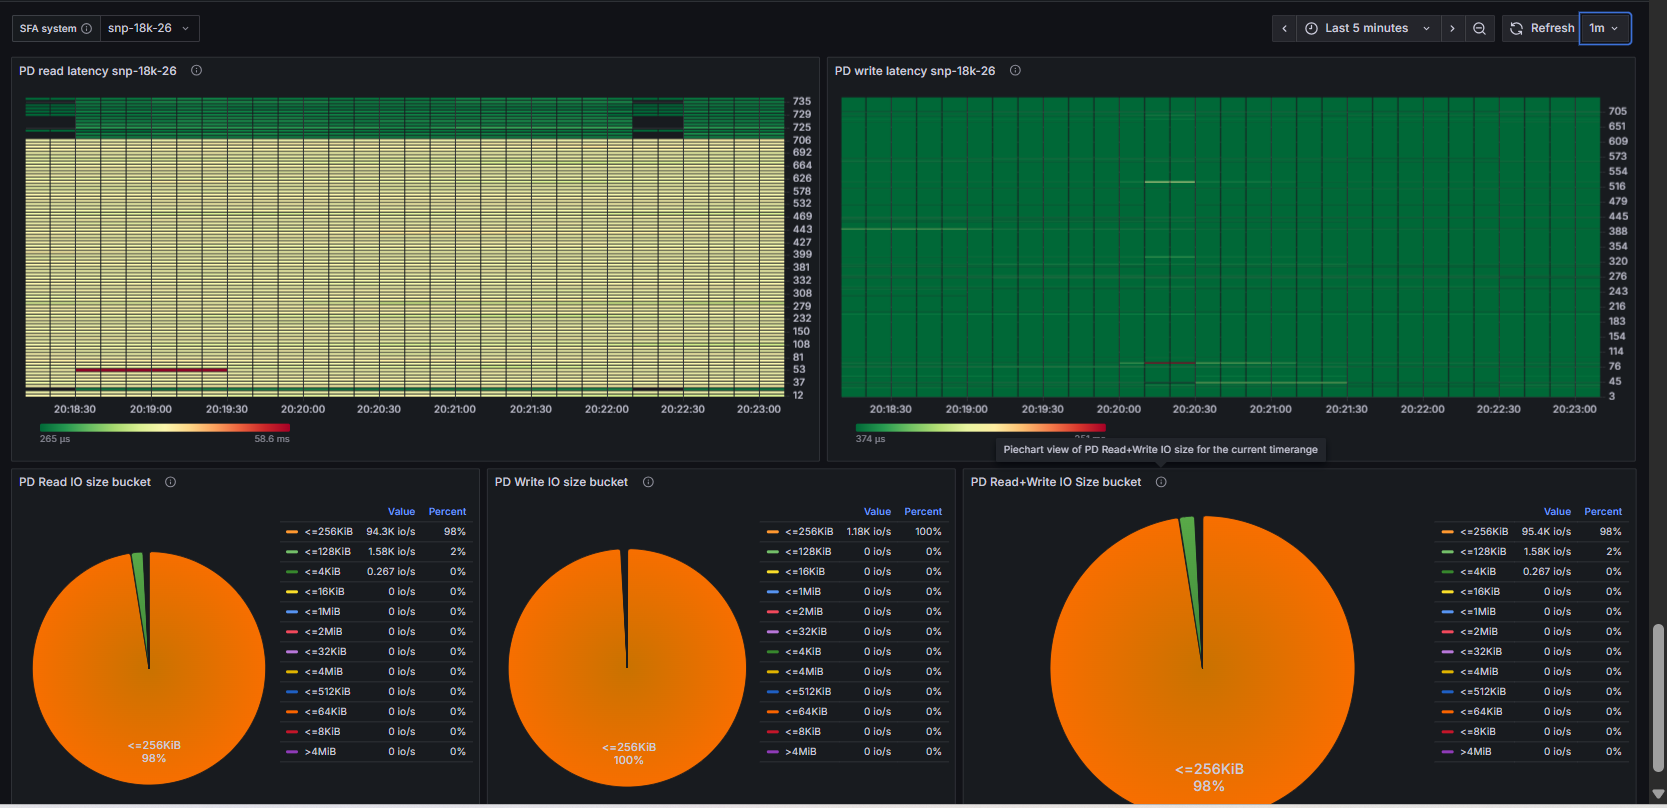
PD Throughput/IOPS/Latency
Physical disk level metrics:
- Aggregate PD Throughput (Read/Write/Fwd/Unmap)
- Aggregate PD IOPS
- Per-PD Read/Write Throughput and IOPS
- PD Read/Write Latency Heatmaps
- PD IO Size Distribution
How Metrics Are Collected
Metrics for this dashboard are collected using:
- OpenTelemetry Collector
- Configured with a Prometheus receiver to scrape:
- SFA Exporter (DDN SFA appliance metrics via API)
Notes
- This dashboard is parameterized via $cluster and $sfa_host variables.
- All queries use PromQL and are compatible with any Prometheus remote-read endpoint.
- For fleet-wide monitoring, use the Multi-Appliance dashboard.
Data source config
Collector config:
Upload an updated version of an exported dashboard.json file from Grafana
| Revision | Description | Created | |
|---|---|---|---|
| Download |