
Docker Stats
Dashboard for the docker container stats exported by https://github.com/callmetigro/simple-docker-exporter
Docker Stats Dashboard
This dashboard provides a comprehensive view of Docker container resource usage based on metrics exported by simple-docker-exporter and collected with Prometheus.
What this dashboard shows
For each Docker container, the dashboard visualizes:
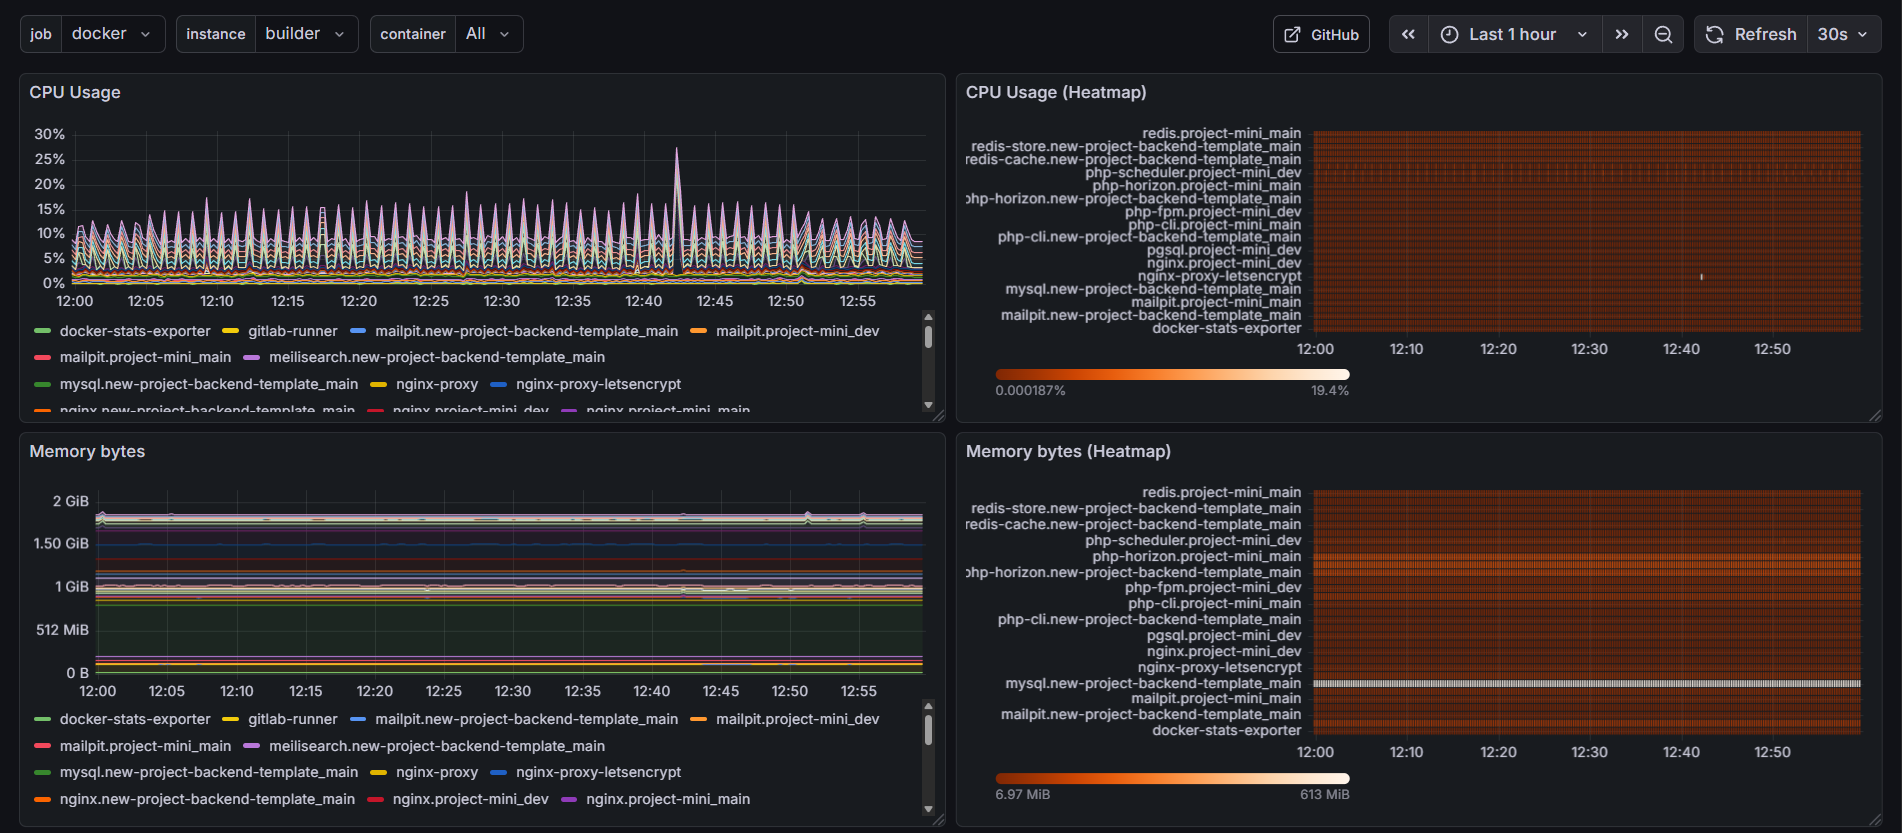
CPU
- CPU usage over time (per container)
- CPU usage heatmap for quick comparison
- Average CPU usage over the selected time range
Memory
- Memory usage in bytes
- Memory usage heatmap
- Memory usage ratio and limits (where available)
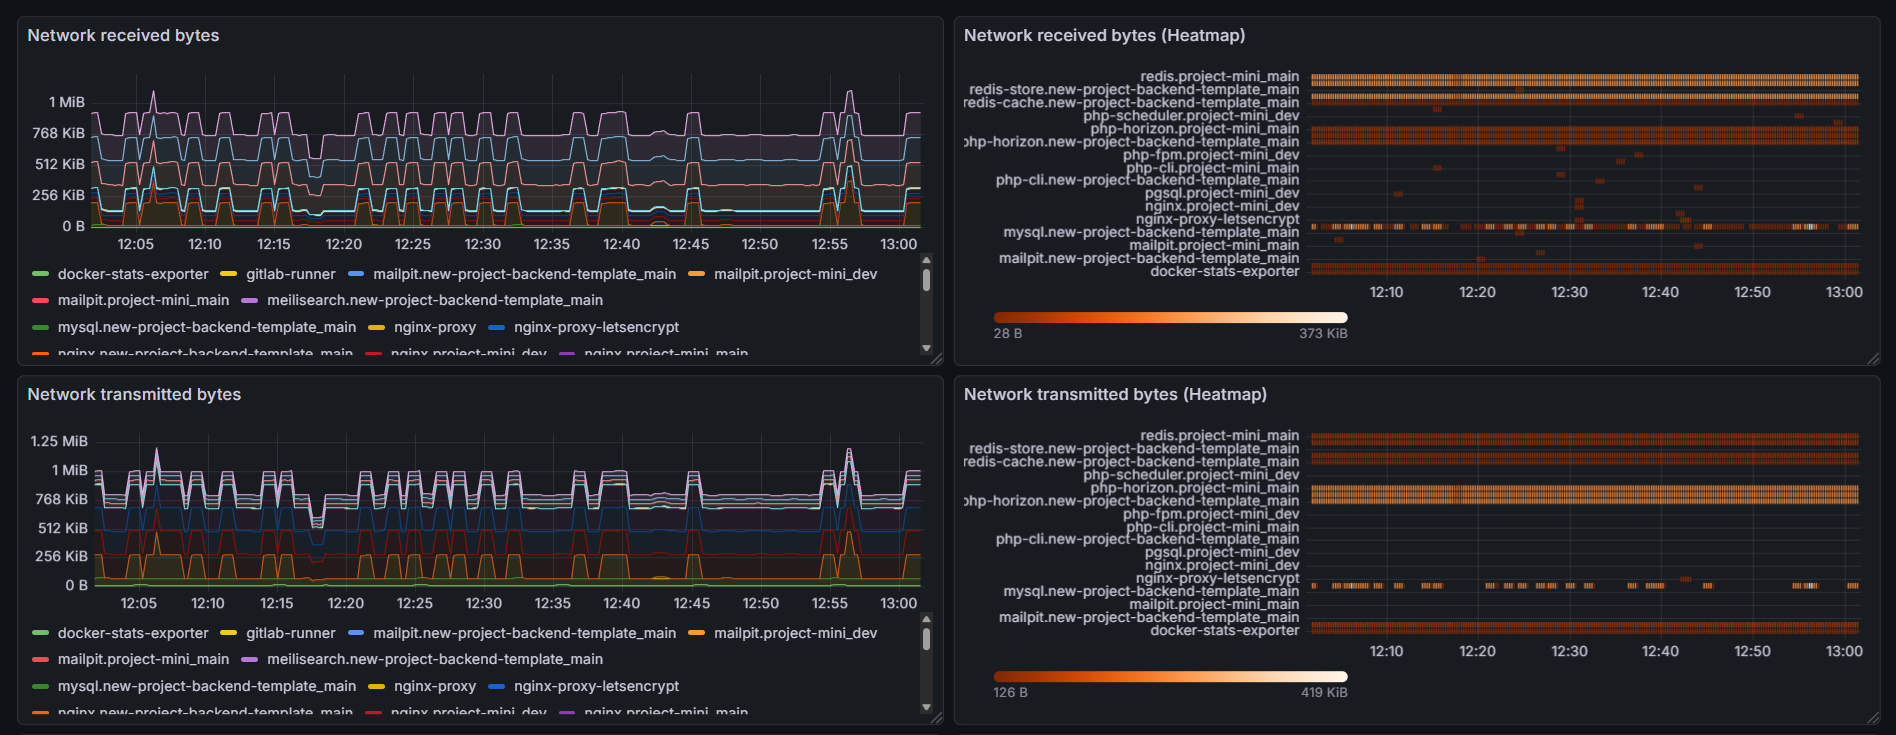
Network
- Network received bytes
- Network transmitted bytes
- Heatmaps for network I/O activity
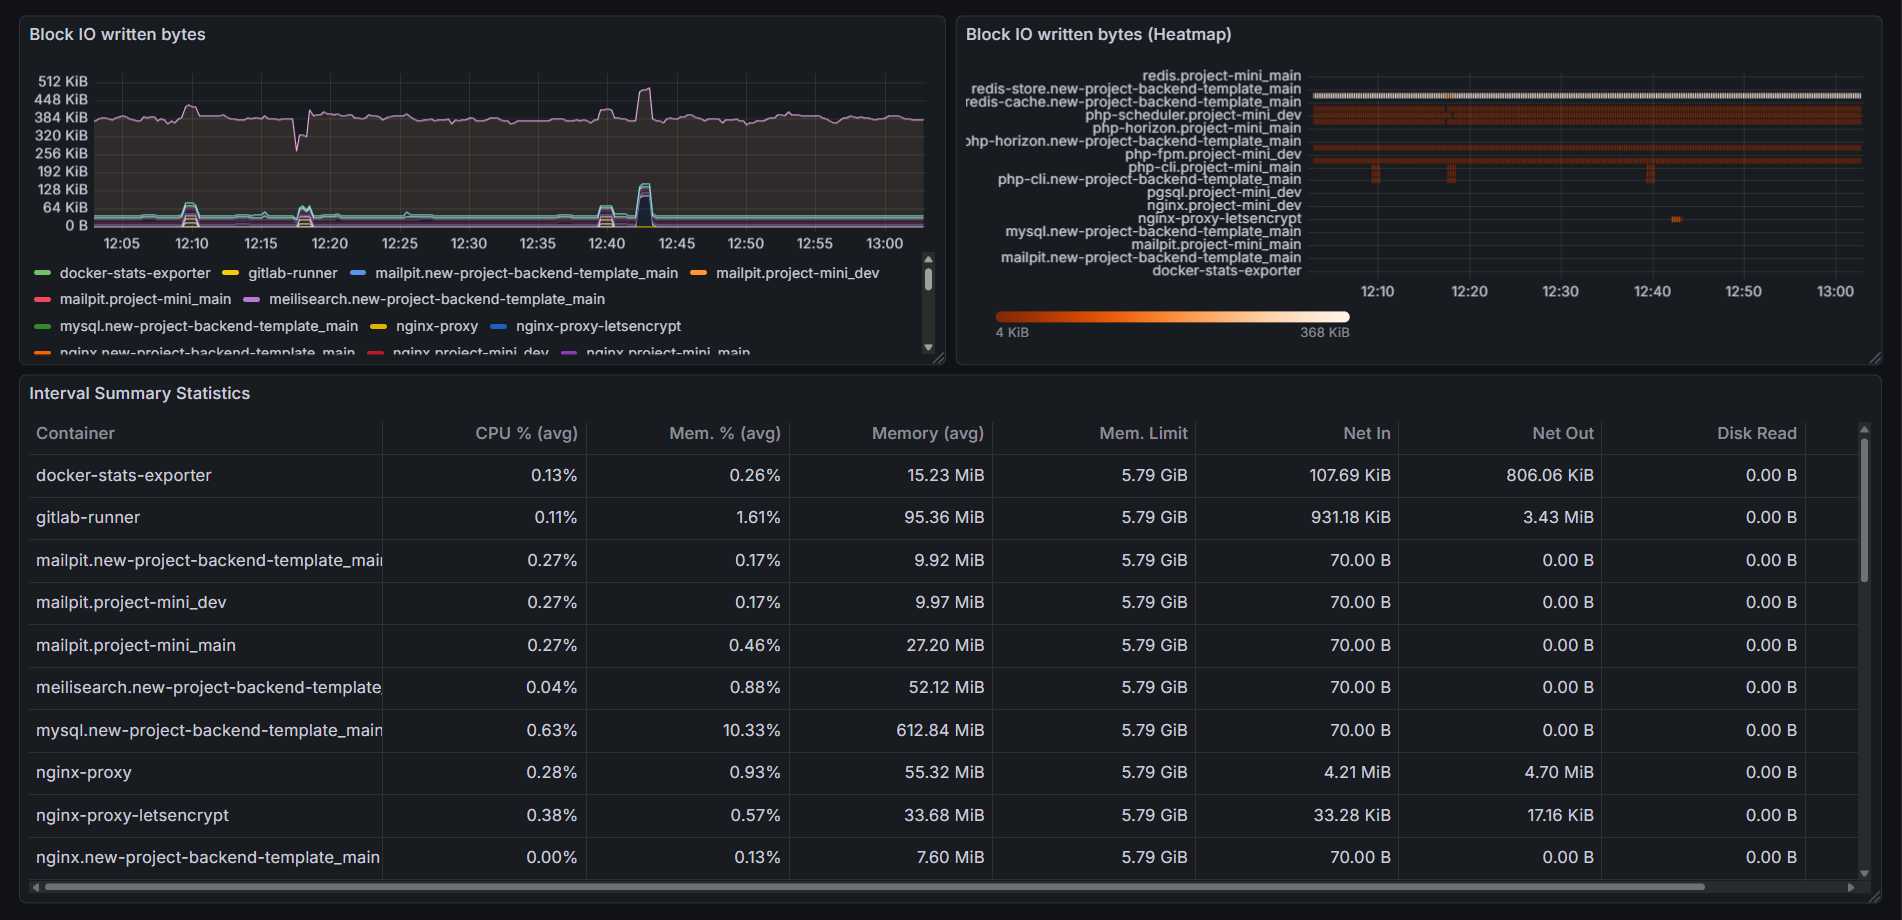
Disk / Block I/O
- Block I/O read bytes
- Block I/O written bytes
- Heatmaps for disk activity
Summary table
A combined table showing average values over the selected time range:
- CPU usage (%)
- Memory usage (%)
- Memory usage (bytes)
- Network I/O
- Disk I/O
Dashboard variables
The dashboard includes the following variables:
- job – Prometheus job label
- instance – Prometheus instance label
- container – Docker container name (supports multi-select and All)
These variables allow flexible filtering across hosts and containers.
Data source requirements
- Prometheus datasource is required
- Metrics must be provided by simple-docker-exporter
Example metrics used:
dockerstats_cpu_usage_ratiodockerstats_memory_usage_bytesdockerstats_network_received_bytesdockerstats_network_transmitted_bytesdockerstats_blockio_read_bytesdockerstats_blockio_written_bytes
Data source config
Collector type:
Collector plugins:
Collector config:
Revisions
Upload an updated version of an exported dashboard.json file from Grafana
| Revision | Description | Created | |
|---|---|---|---|
| Download |
Docker
Easily monitor Docker with Grafana Cloud's out-of-the-box monitoring solution.
Learn more