
AdGuard Home Multi-Instance Monitoring (Prometheus Exporter)
Grafana dashboard for monitoring multiple AdGuard Home instances using the AdGuard Home Exporter. Provides clean visual insights into DNS queries, blocks, client activity, upstream performance, filter usage, and instance health. Fully supports multi-instance monitoring via your Prometheus exporter: https://github.com/JonanekDev/AdGuardHome-Exporter
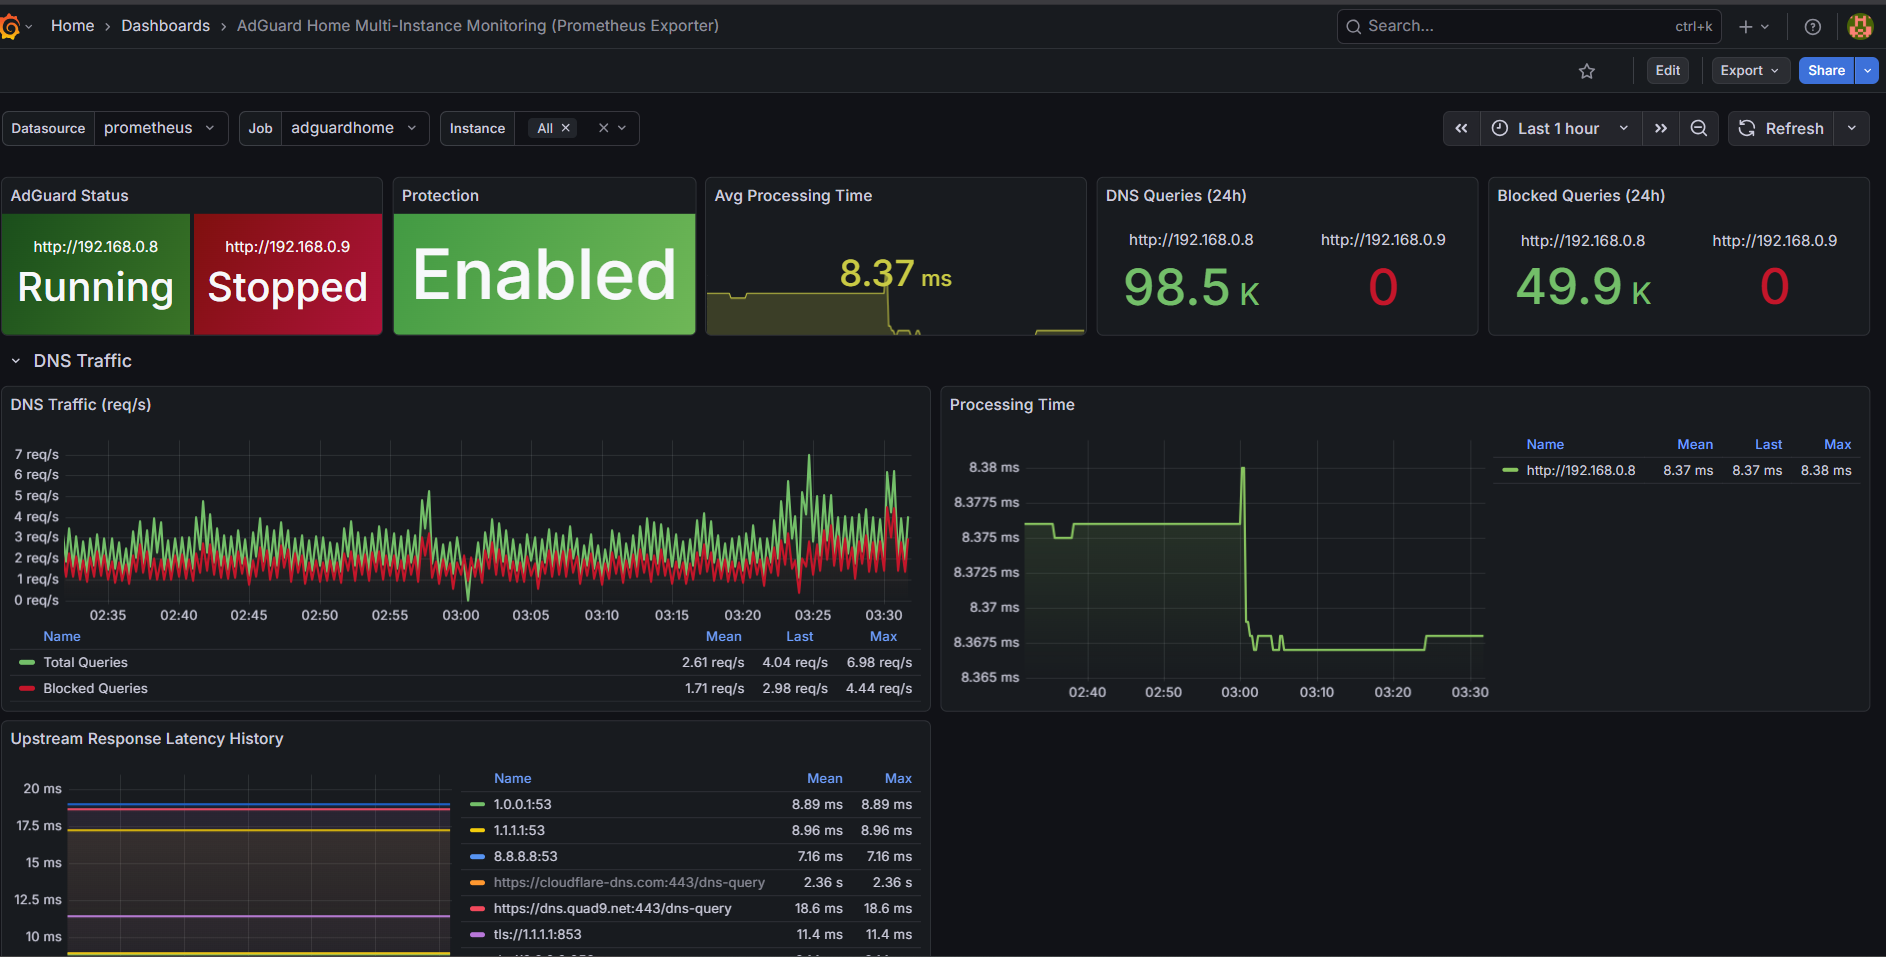
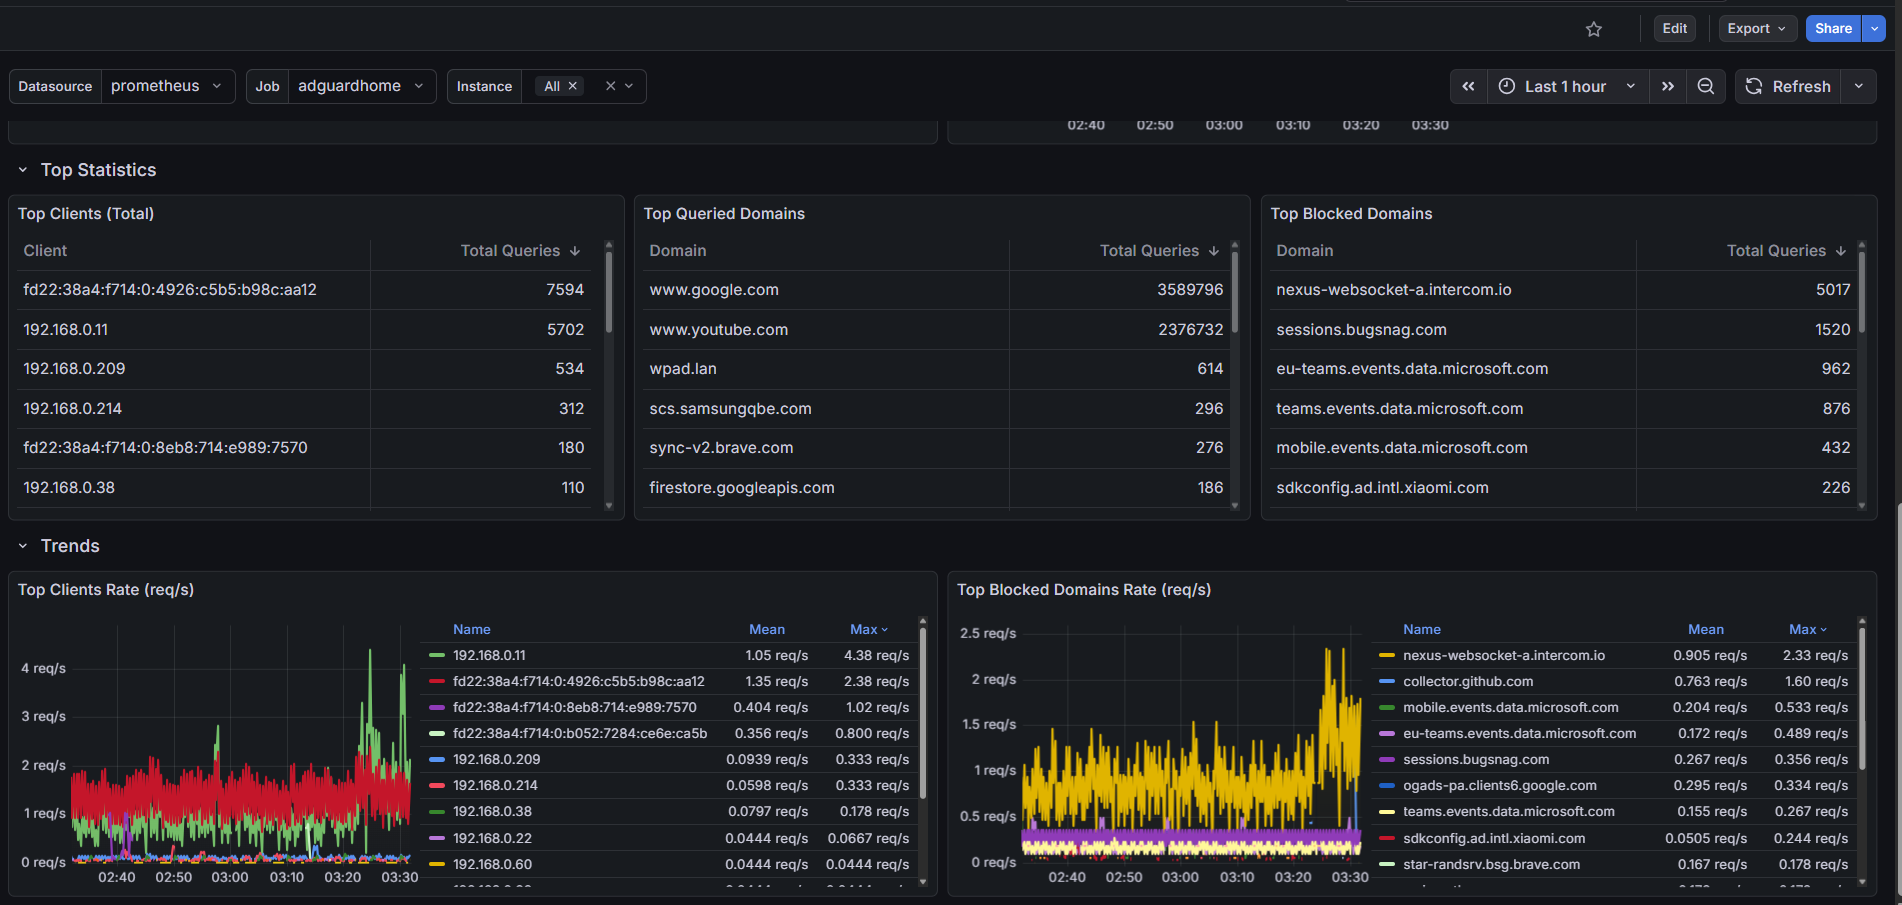
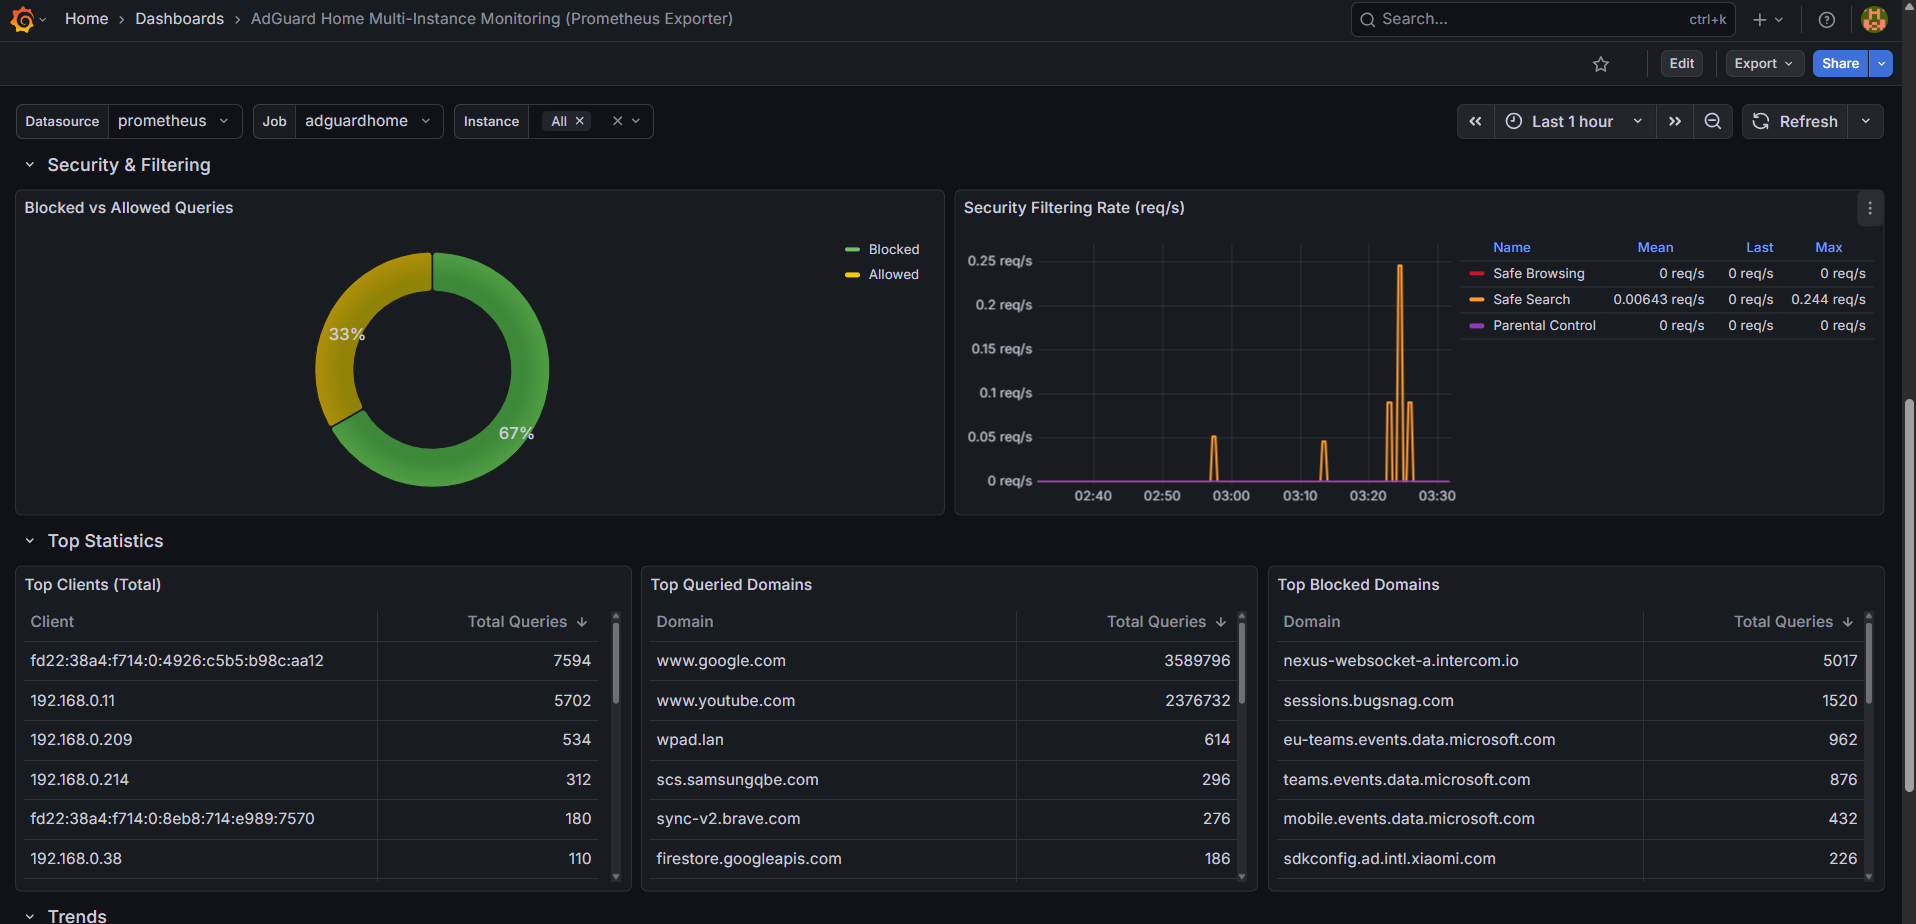
**AdGuard Home – Multi-Instance Monitoring Dashboard ** This dashboard visualizes metrics collected by the AdGuard Home Exporter, supporting monitoring of multiple AdGuard servers simultaneously.
Requirements
Prometheus
AdGuard Home Exporter (supports multiple instances): https://github.com/JonanekDev/AdGuardHome-Exporter
Prometheus Setup
Add your exporter target(s):
scrape_configs:
  - job_name: "adguardhome"
    static_configs:
      - targets: ["127.0.0.1:9100"]
Exporter Configuration
The exporter accepts comma-separated lists to monitor multiple servers:
ADGUARD_URLS=192.168.0.8,192.168.0.9
ADGUARD_USERNAMES=Admin,Admin
ADGUARD_PASSWORDS=Pass1,Pass2
Data source config
Collector config:
Upload an updated version of an exported dashboard.json file from Grafana
| Revision | Description | Created | |
|---|---|---|---|
| Download |
Home Assistant
Easily monitor Home Assistant, an open source software platform designed for home automation, with Grafana Cloud's out-of-the-box monitoring solution.
Learn more