
Navidrome
Navidrome dashboard. Exposes system metrics, as well as Subsonic client requests and plugin usage.
This displays Prometheus metrics collected from Navidrome.
Metrics displayed:
- Media stats (tracks, albums, artists, scan stats)
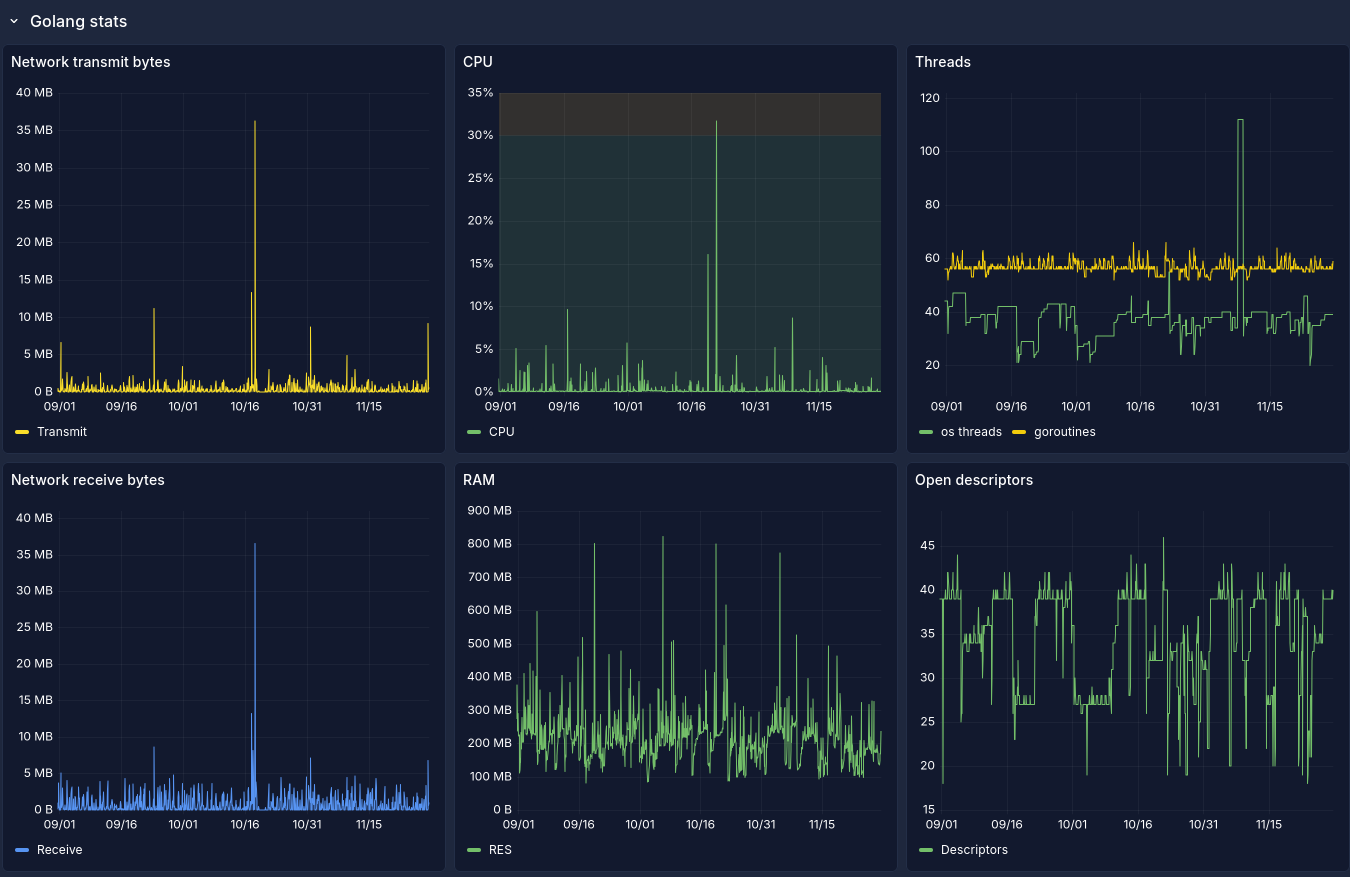
- Resource usage (net tx/rx, cpu, memory, threads, descriptors)
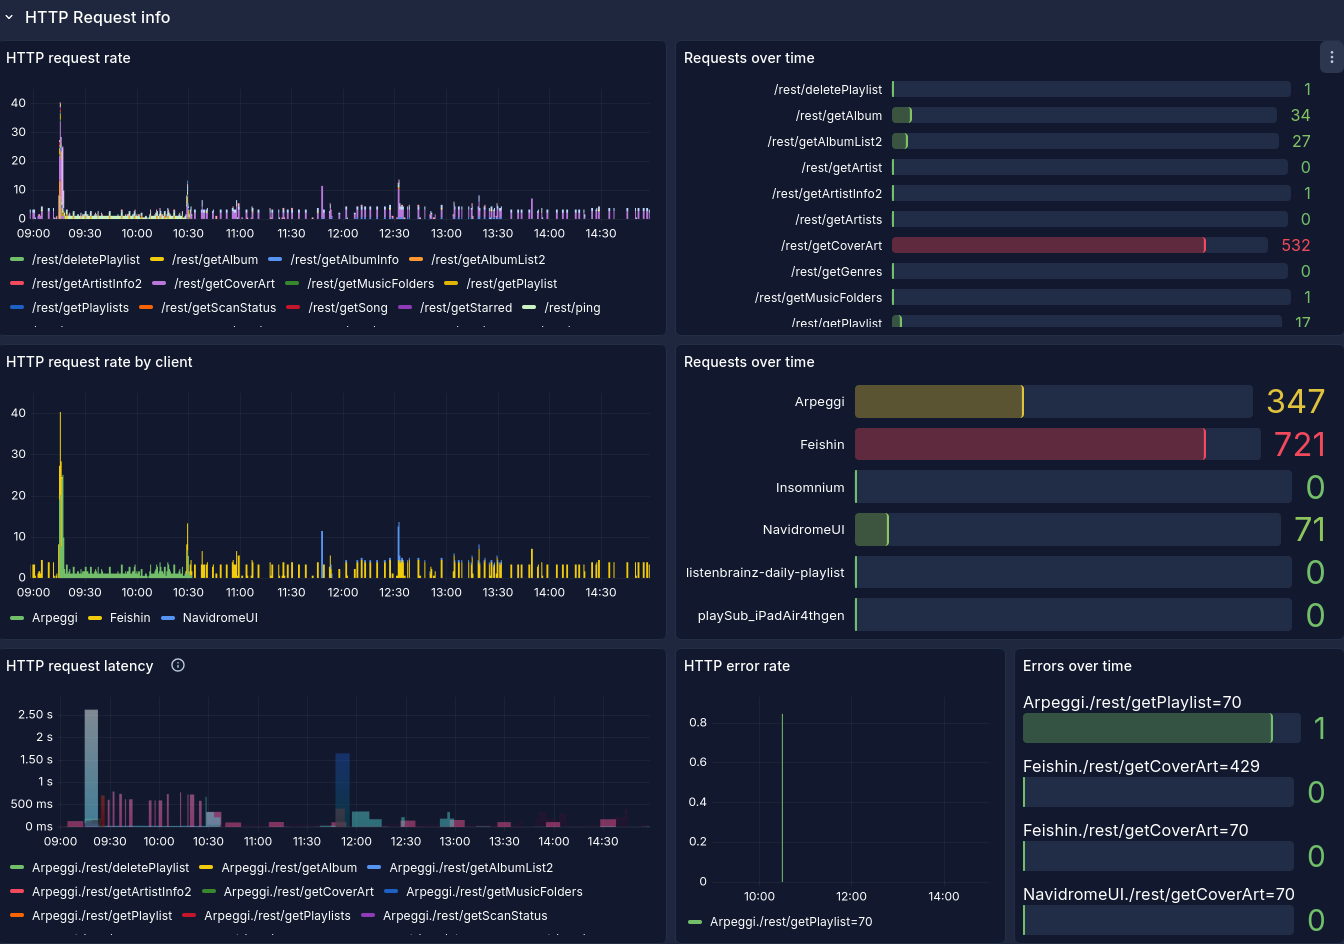
- Subsonic API usage (count, latency, errors)
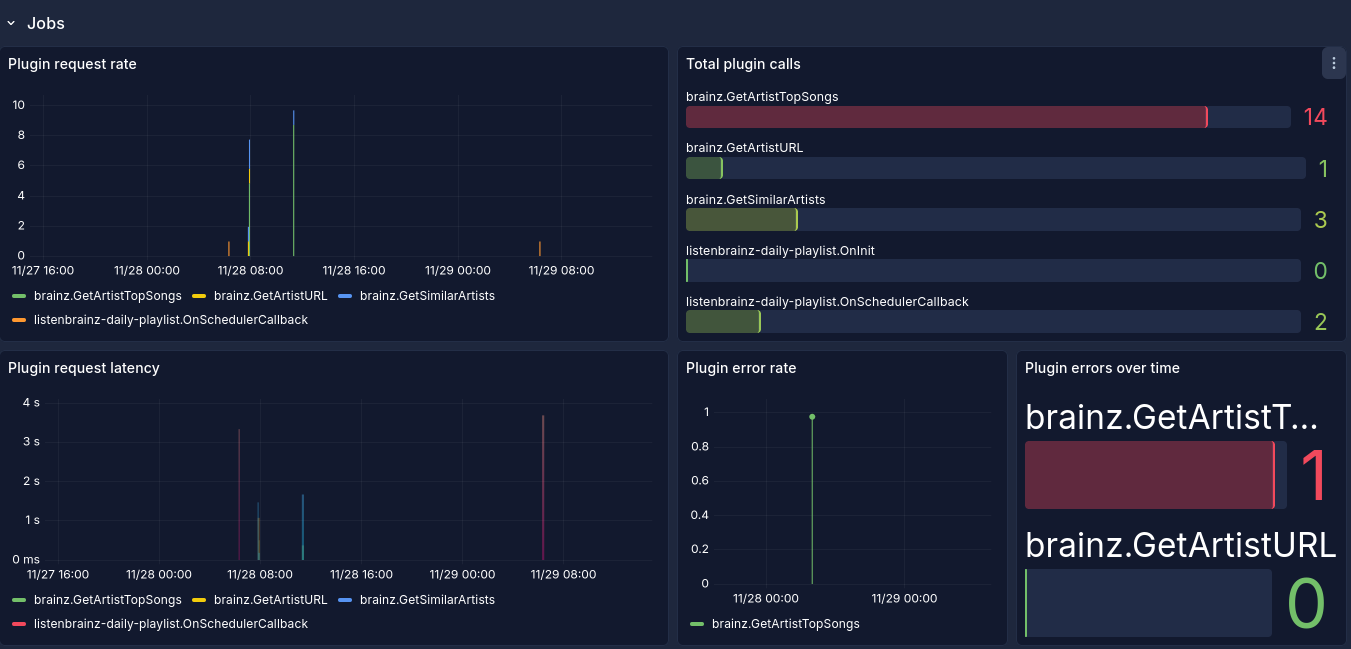
- Plugin usage
To enable in Navidrome, add the following to your TOML configuration
Prometheus.Enabled = true
# Recommended
Prometheus.Password = "replace me with your password"
If a password is specified, then you must scrape the endpoint using HTTP basic authentication. The username is navidrome
Data source config
Collector type:
Collector plugins:
Collector config:
Revisions
Upload an updated version of an exported dashboard.json file from Grafana
| Revision | Description | Created | |
|---|---|---|---|
| Download |