
n8n Workflow & Execution Analytics
Comprehensive analytics dashboard for n8n workflow automation platform. Monitor workflow execution performance, track success rates, identify bottlenecks, and optimize your automation workflows. https://github.com/nluecke/grafana-n8n-dashboards/tree/main/dashboards/postgresql
n8n Workflow & Execution Analytics Dashboard
A structured Grafana dashboard for analyzing n8n workflow and execution performance using the PostgreSQL database backend.
It complements the system-level Prometheus dashboard by focusing on workflow quality, throughput, errors, and trends.
Overview
This dashboard provides analytical insights into your n8n automation system, including workflow statistics, execution performance, error hotspots, queue depth, and long-running executions.
Features
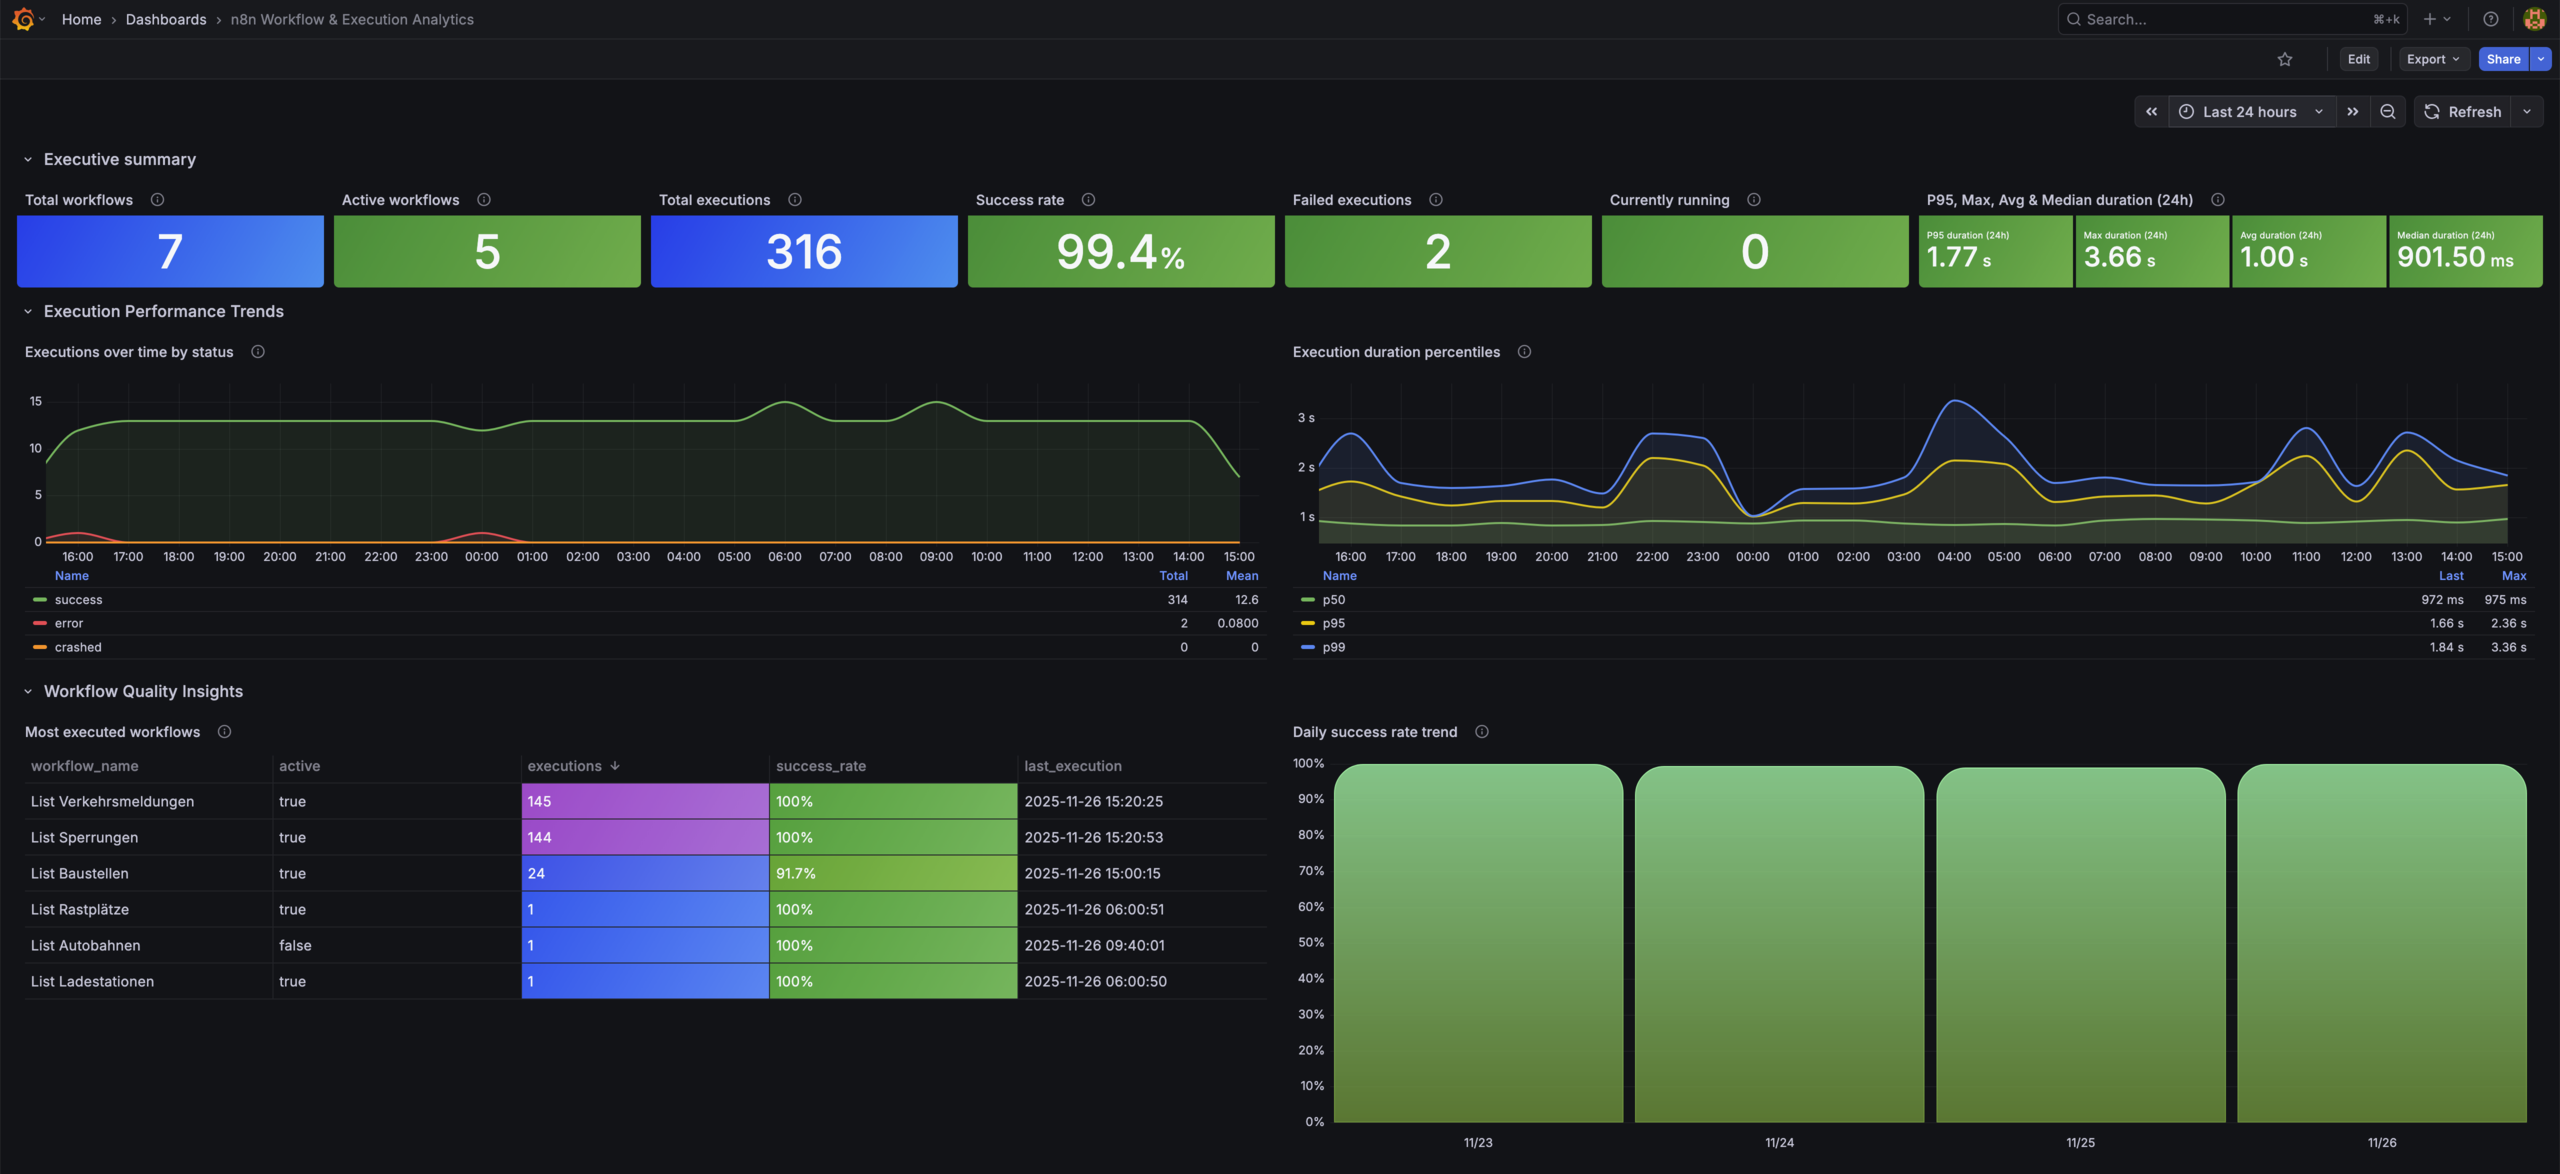
Executive Summary
- Total workflows
- Enabled (active) workflows
- Executions in time range
- Success rate
- Failed executions
- Currently running executions
Execution Performance Trends
- Executions over time by status
- P50/P95/P99 execution duration
- 24h latency snapshot: avg, max, median, P95
Workflow Quality Insights
- Most executed workflows
- Daily success rate trend
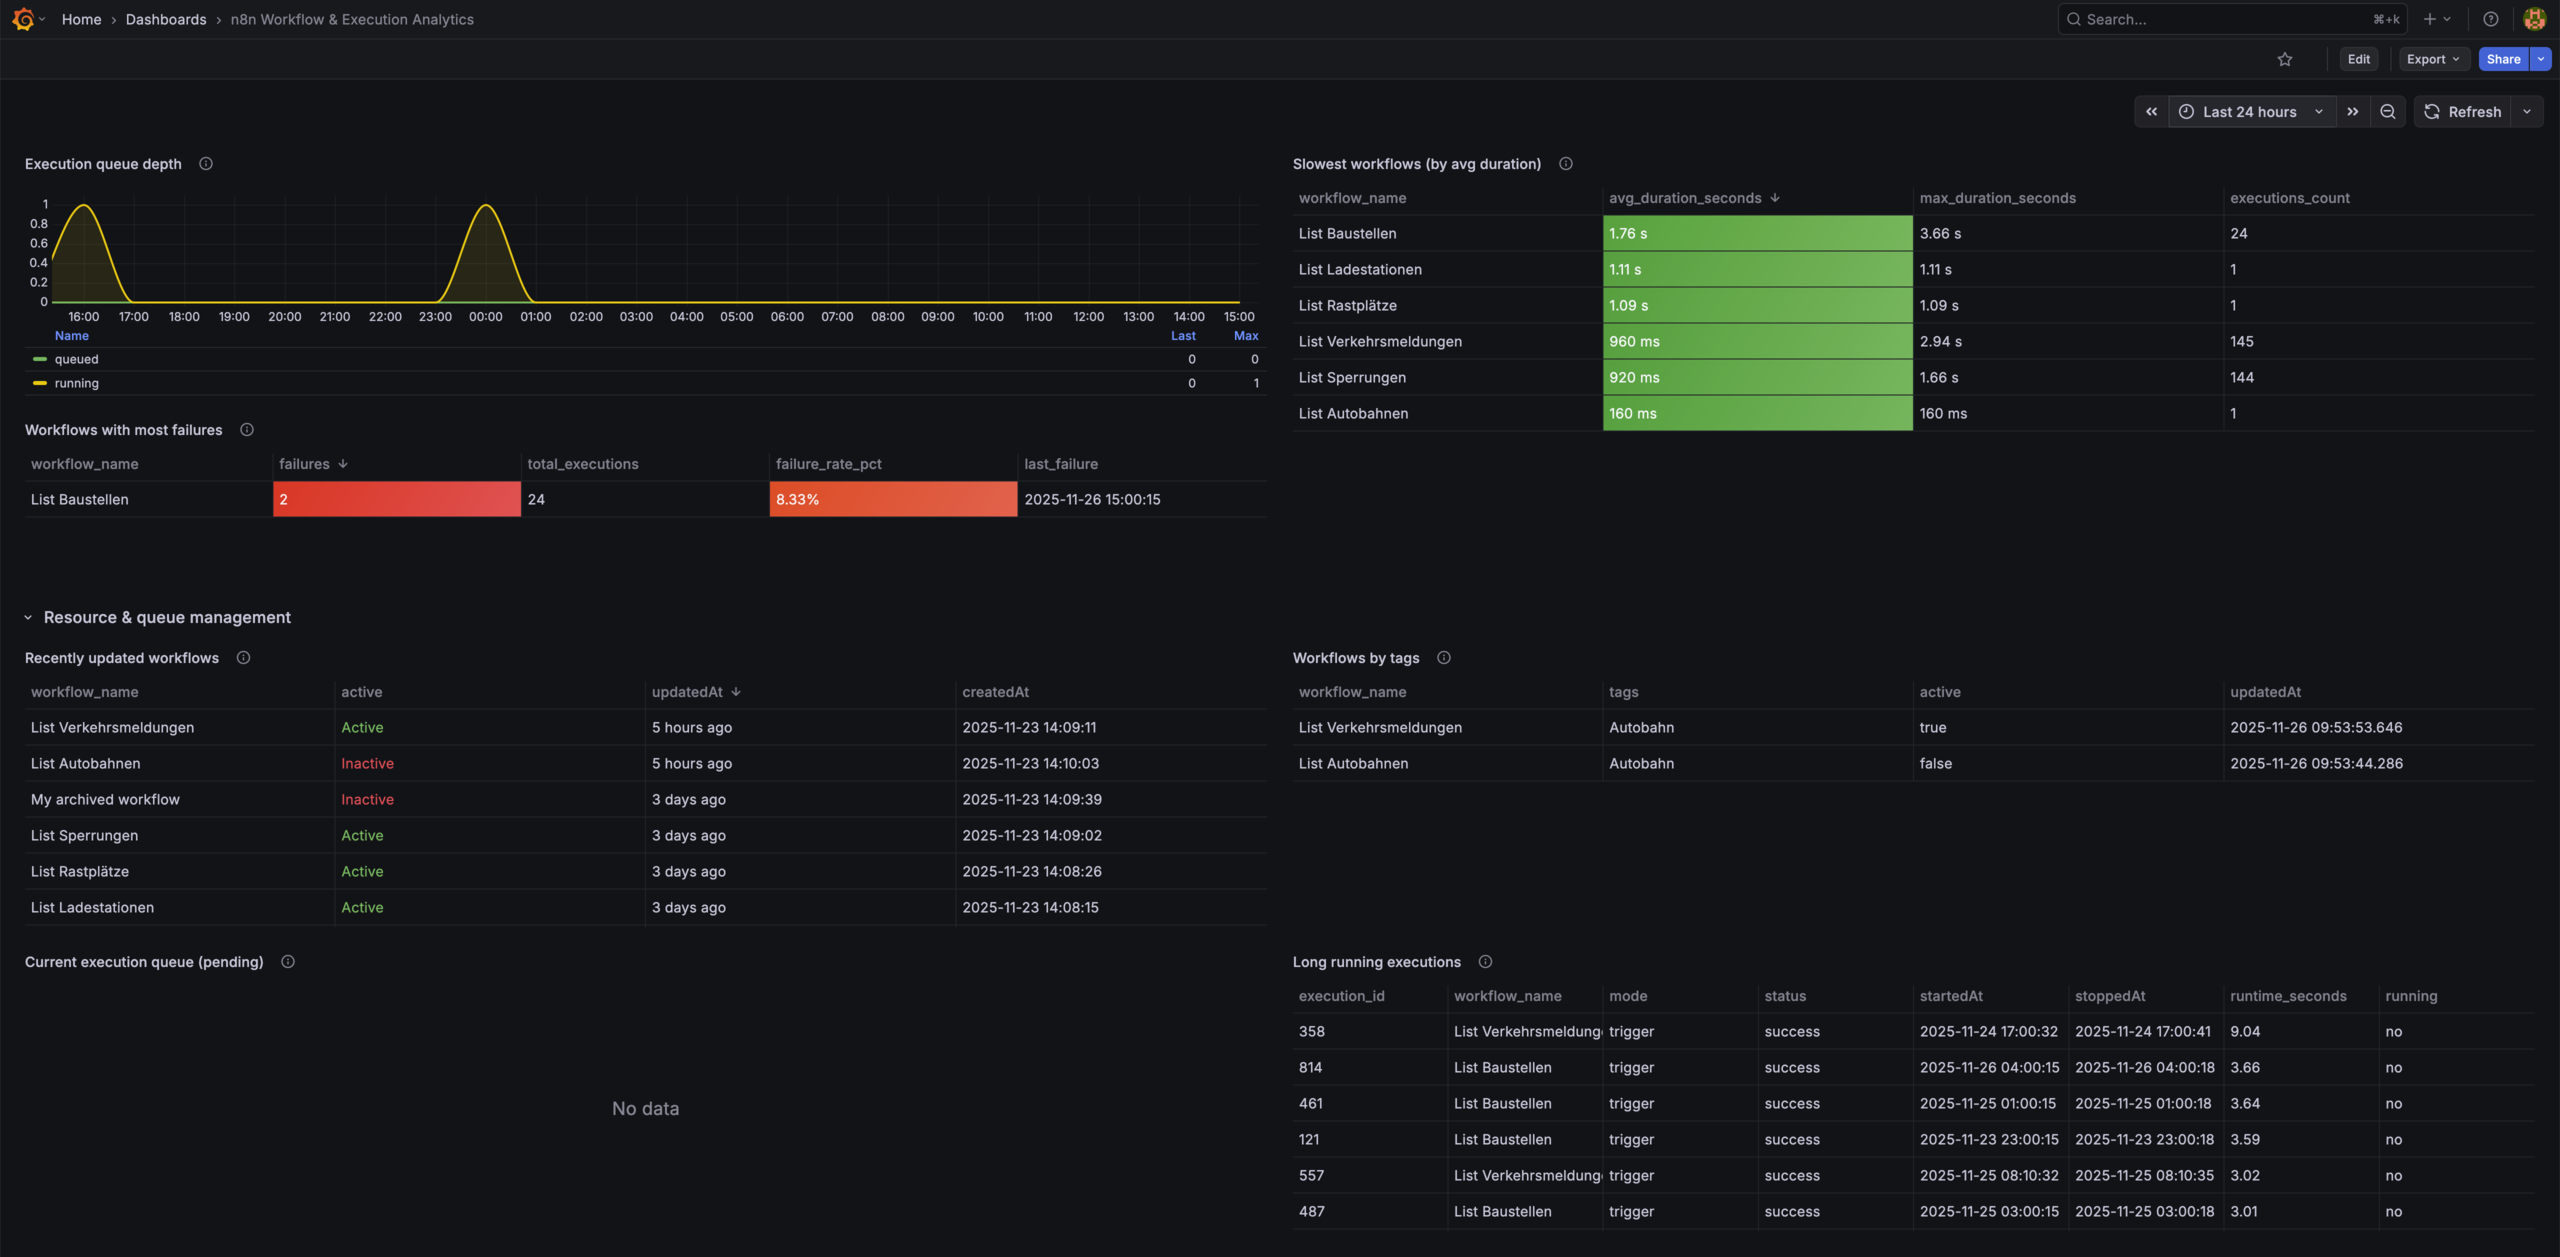
- Workflows with most failures
- Slowest workflows
Resource & Queue Management
- Execution queue depth
- Real-time queue
- Long-running executions
- Recently updated workflows
- Workflows by tag
- Recent execution errors
Requirements
Software
- Grafana ≥ 9 (tested on Grafana Cloud & Grafana 12)
- n8n with PostgreSQL backend
- PostgreSQL ≥ 12
Grafana Datasource
- Built-in PostgreSQL datasource
Required Database Tables
workflow_entityexecution_entitytag_entityworkflows_tags
Installation
1. Configure PostgreSQL Datasource
In Grafana:
- Go to Configuration → Data Sources → Add data source
- Select PostgreSQL
- Configure:
Host: <your-db-host>:5432
Database: n8n
User: readonly-user
Password: ********
SSL Mode: require
- Save and note the datasource UID.
2. Import the Dashboard
Option A: JSON Import
- Download
n8n-workflow-execution-analytics.json - Go to Dashboards → Import
- Upload JSON
- Select your PostgreSQL datasource
Option B: Grafana.com
- Dashboard ID: 24475
Metrics Used
This dashboard uses SQL queries directly against the PostgreSQL schema generated by n8n.
Main datasets:
- Workflow metadata (enabled, tags, updated)
- Execution logs (status, timings, errors)
- Execution duration statistics
- Queue depth & running jobs
Notes
This dashboard is intended for workflow-level observability and pairs naturally with the system-level Prometheus dashboard.
Data source config
Collector config:
Upload an updated version of an exported dashboard.json file from Grafana
| Revision | Description | Created | |
|---|---|---|---|
| Download |
Adobe Analytics
With the Grafana plugin for Adobe Analytics, you can quickly visualize and query your Adobe Analytics data from within Grafana.
Learn more