
Angie Metrics
Performance metrics for Angie (using the status API)
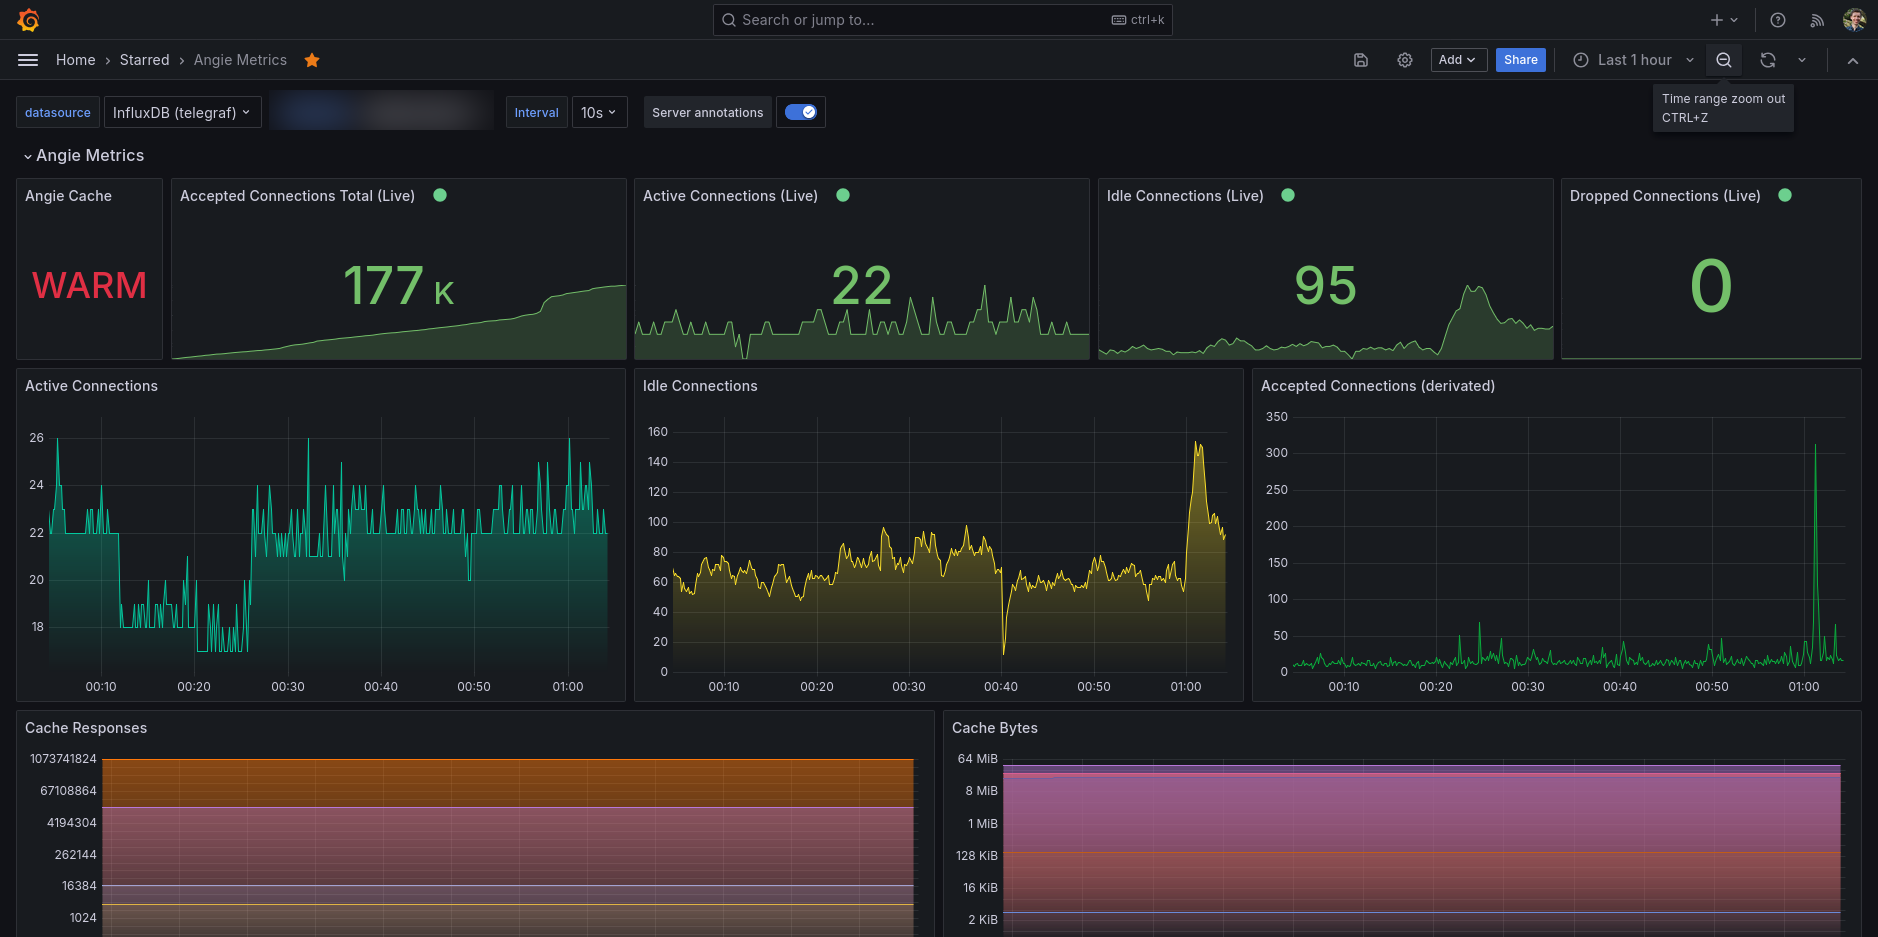


Angie metrics dashboard, it's collecting data via Telegraf (using my own Angie Telegraf input plugin).
You will need to migrate to NGINX to Angie in order to take advanced of status API interface (migration is very simple). Since the free nginx will not provide such an interface unless use buy NGINX Plus. However, Angie does come with such a status API for free.
You will however need to use my provided Telegraf plugin. See the README instructions on GitHub how-to build the code and how to add an external Telegraf plugin to your existing Telegraf setup. The Nginx Plus plugin from Telegraf itself will not work with Angie, and my plugin is currently not included yet in Telegraf (sorry). But you can easily setup my plugin as an external plugin with Telegraf, that will work just fine. Again, see the README how to setup this plugin.
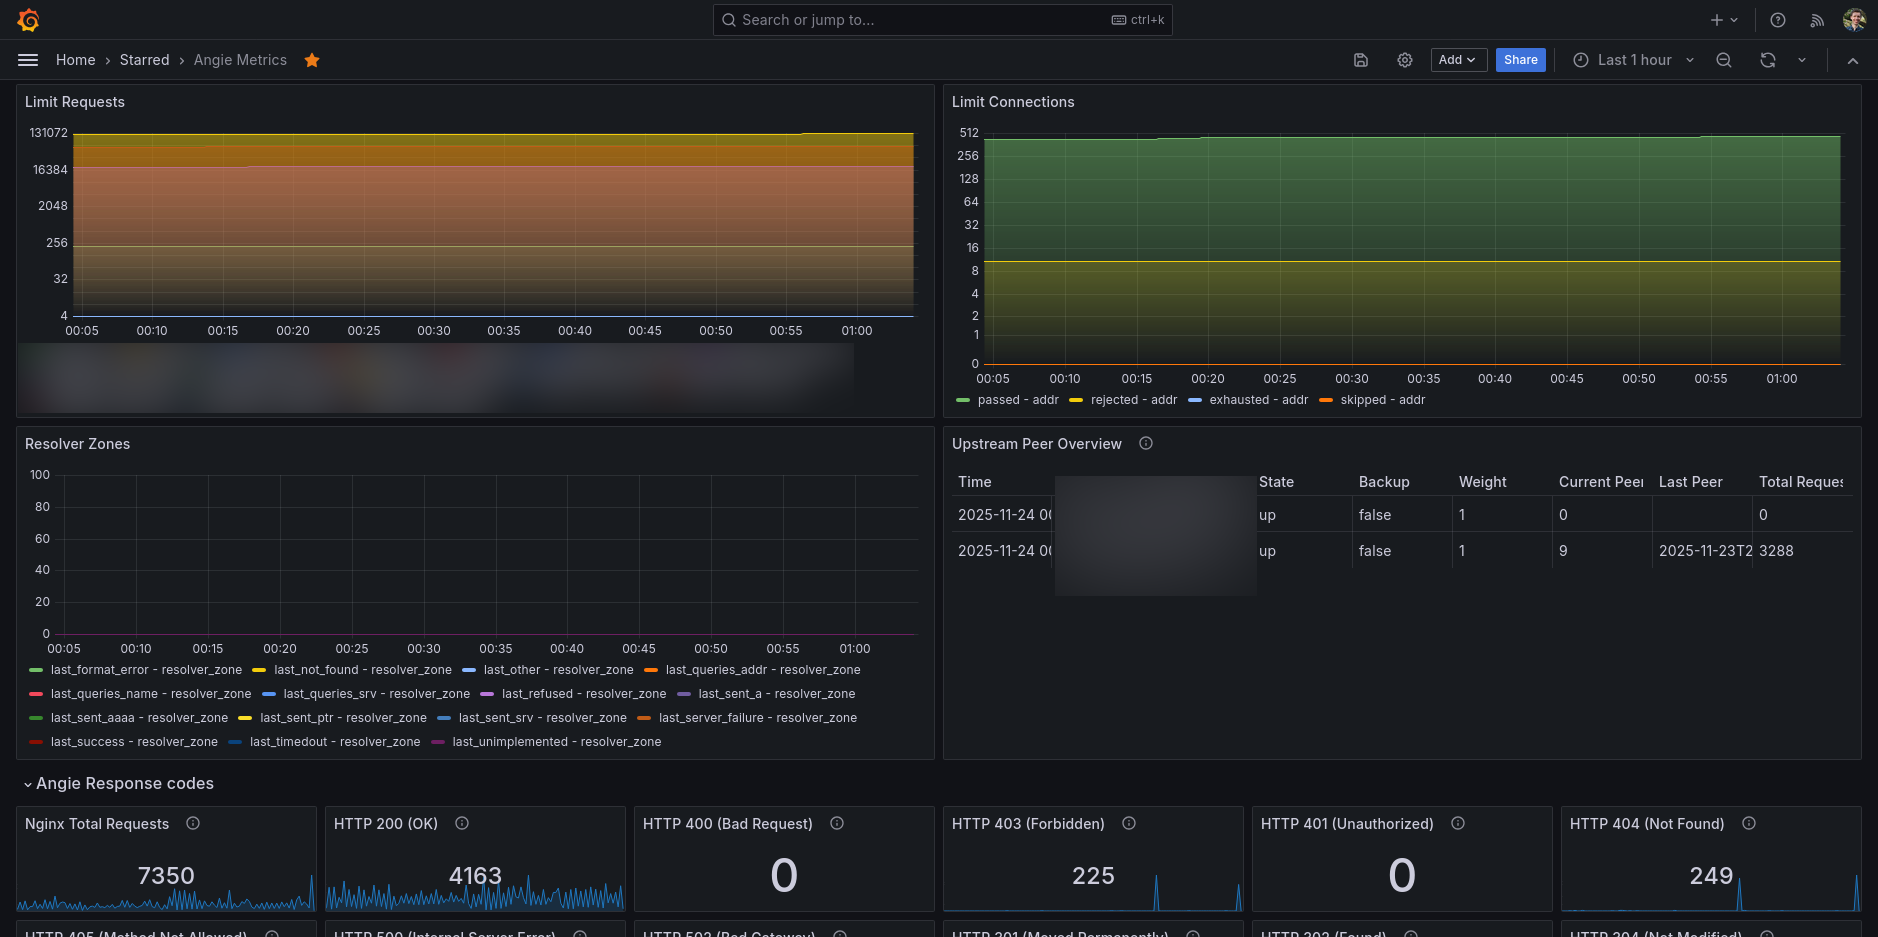
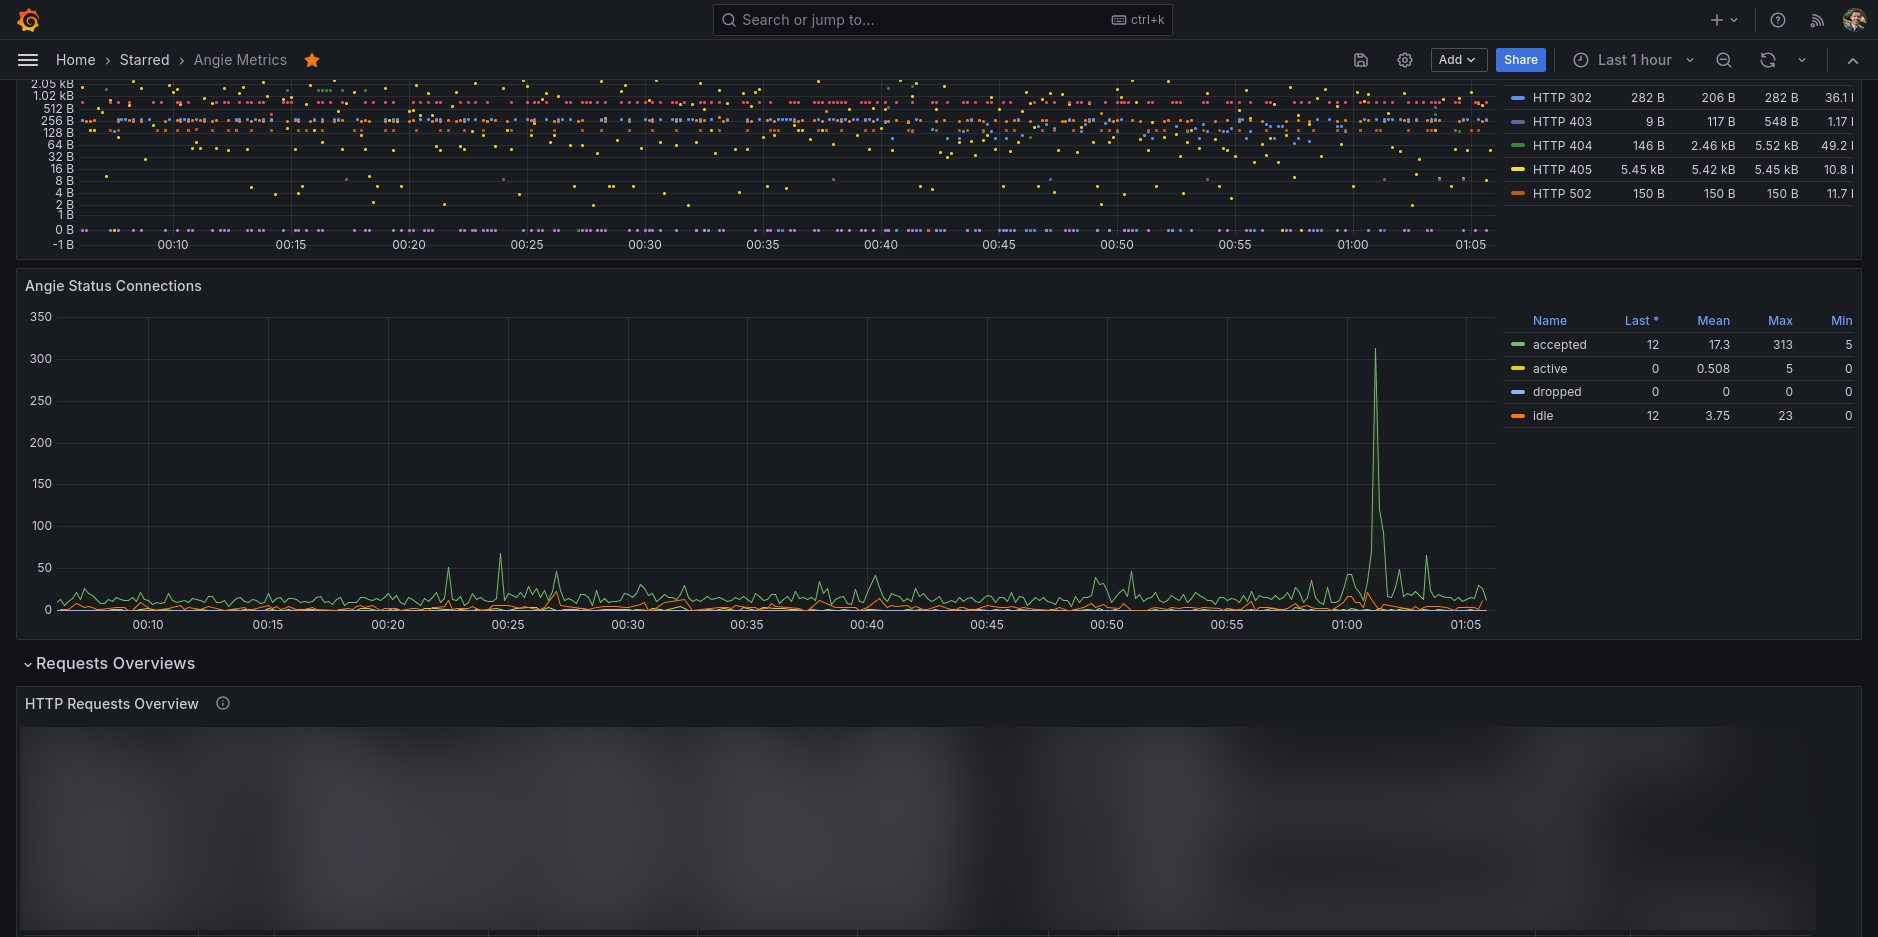
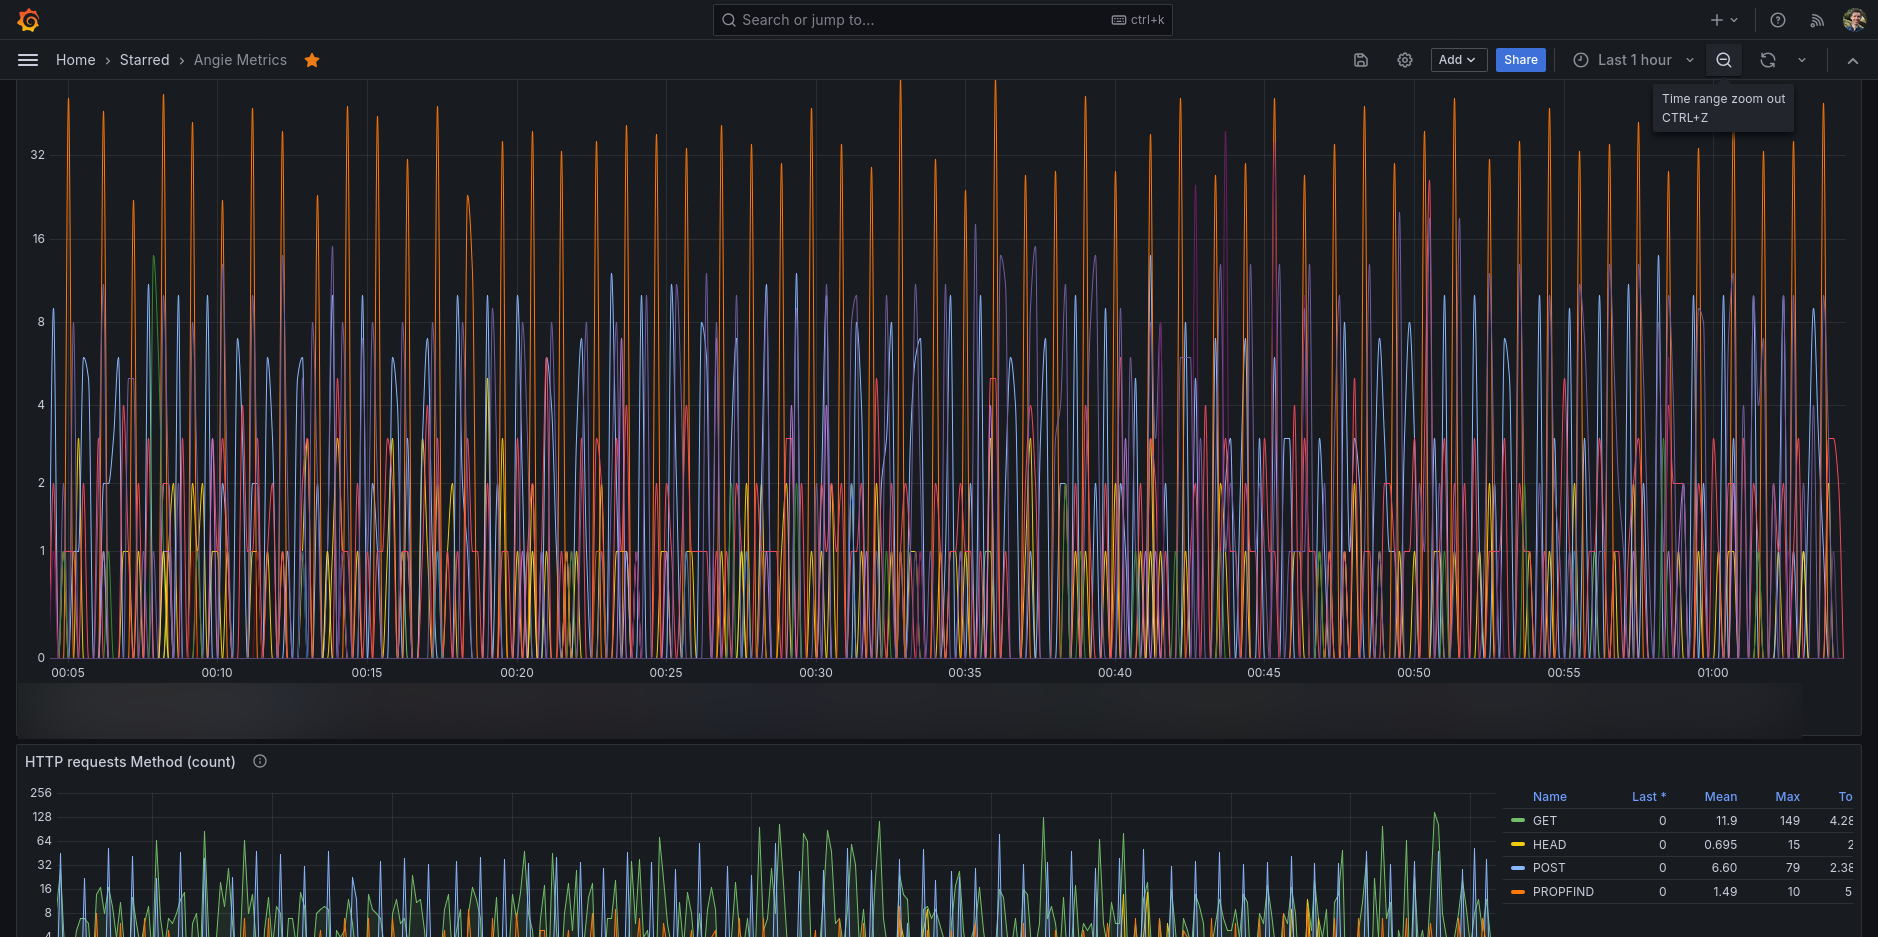
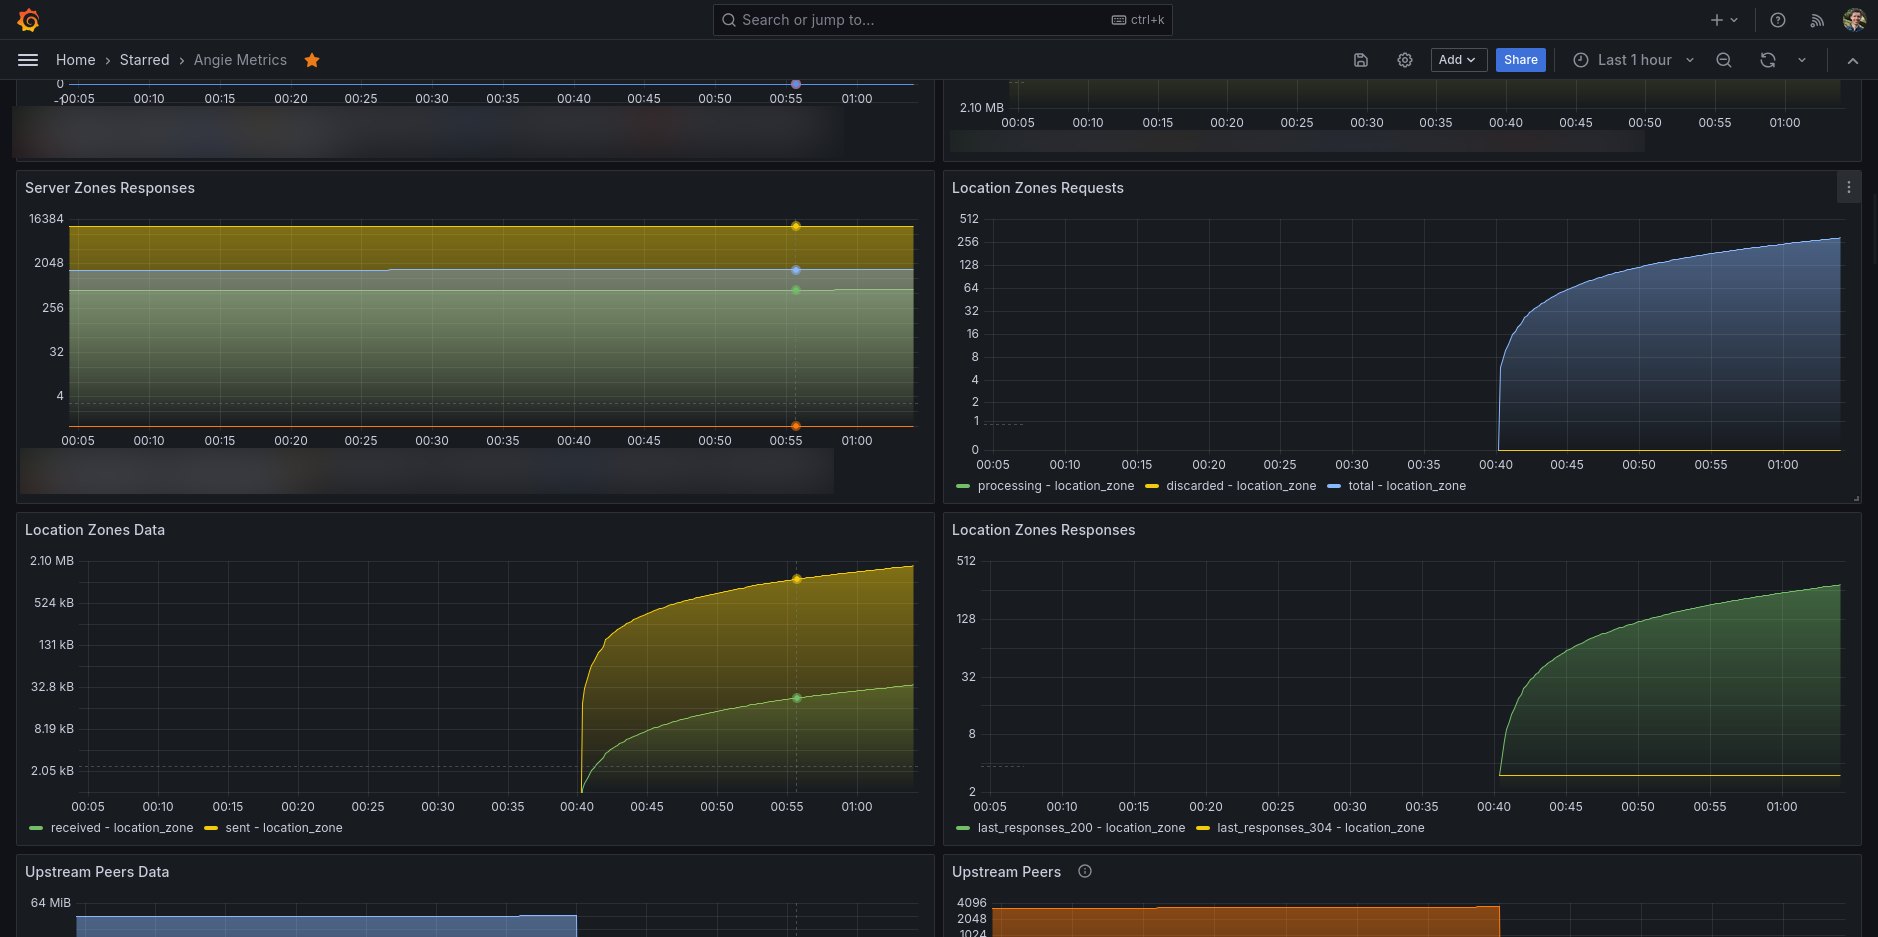
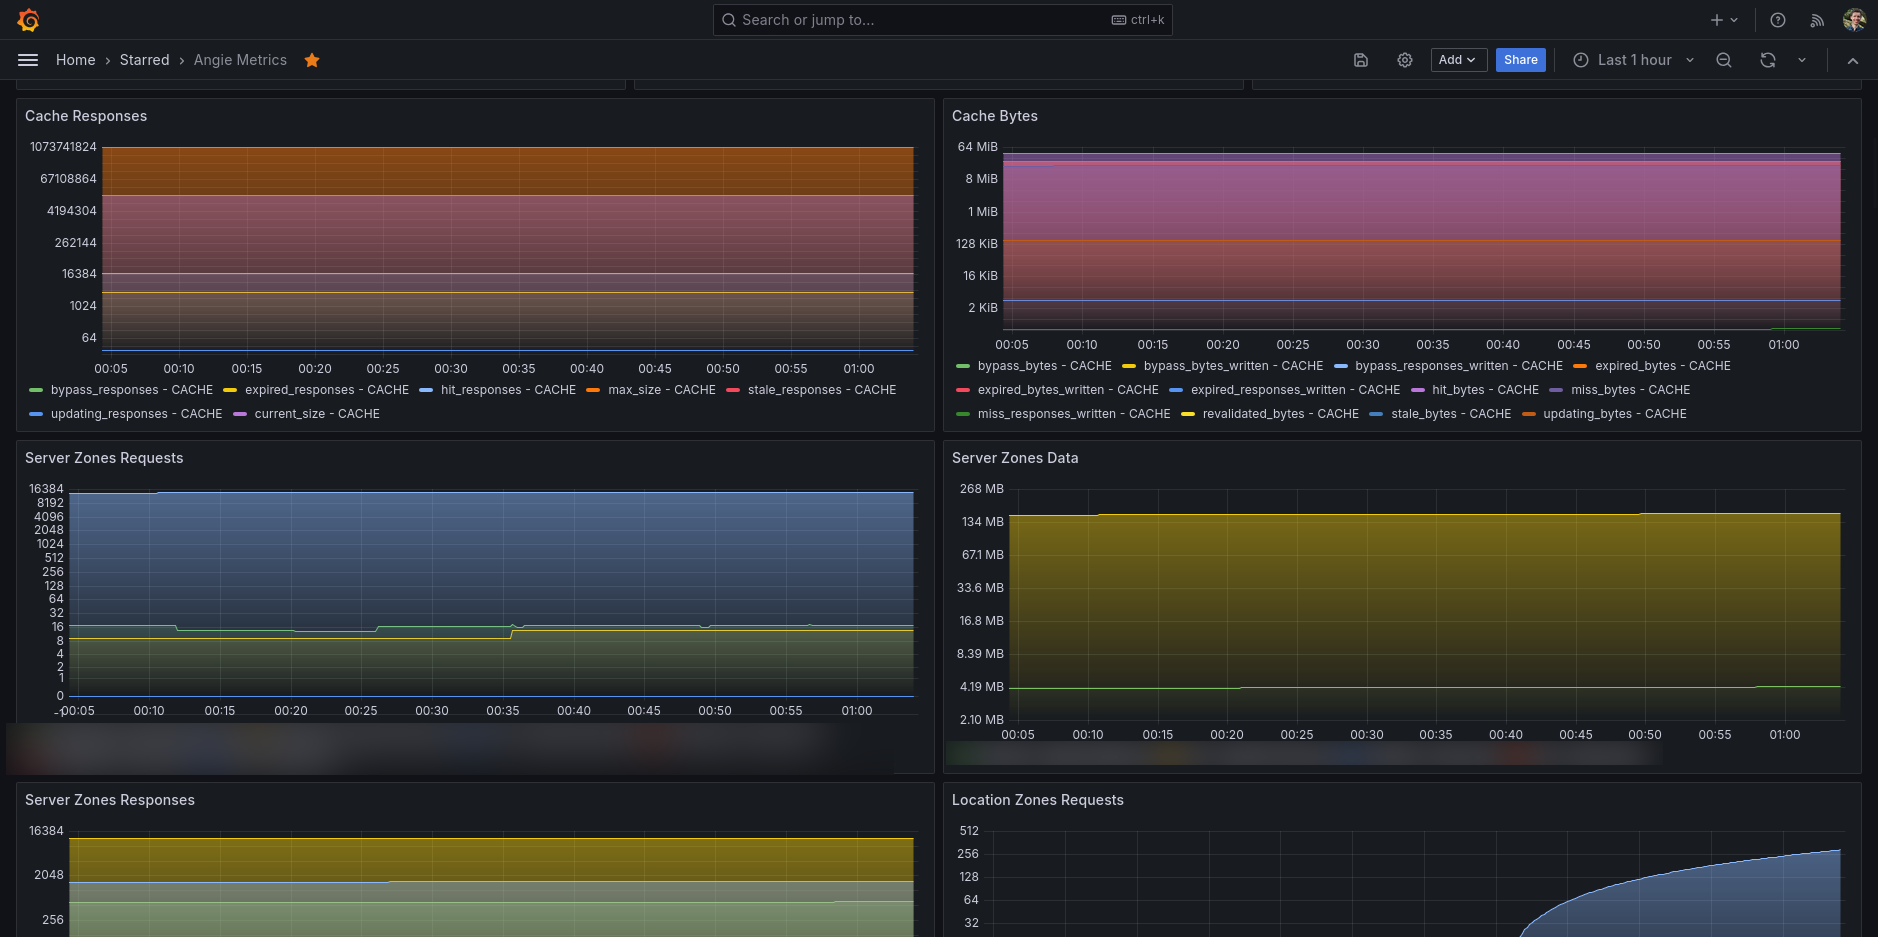
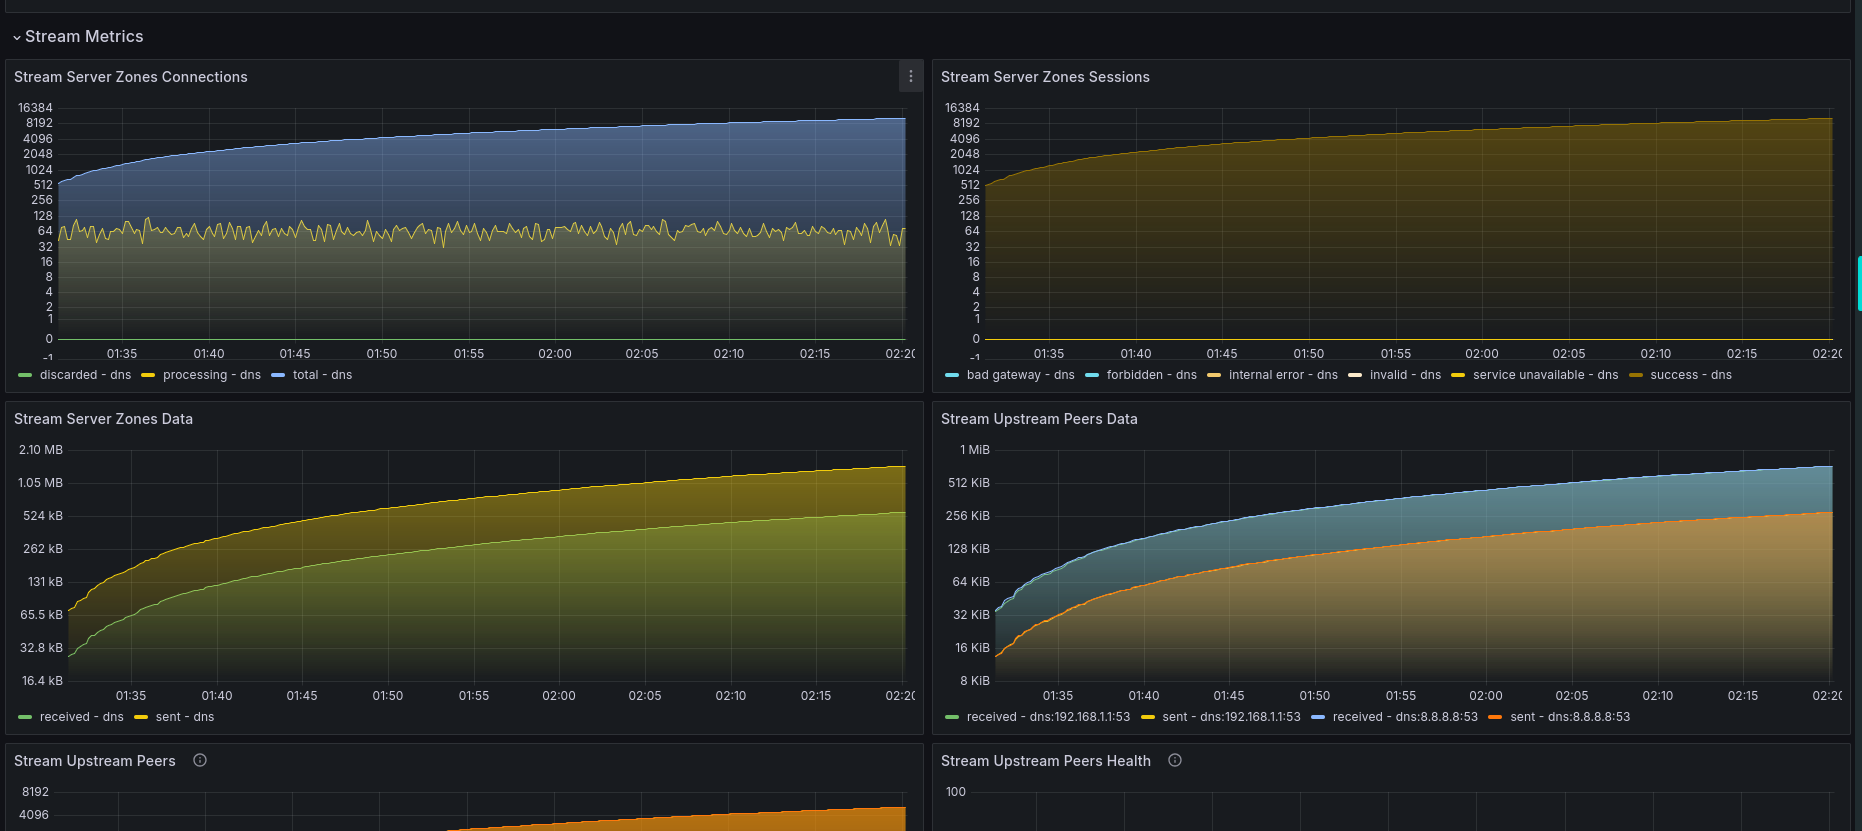
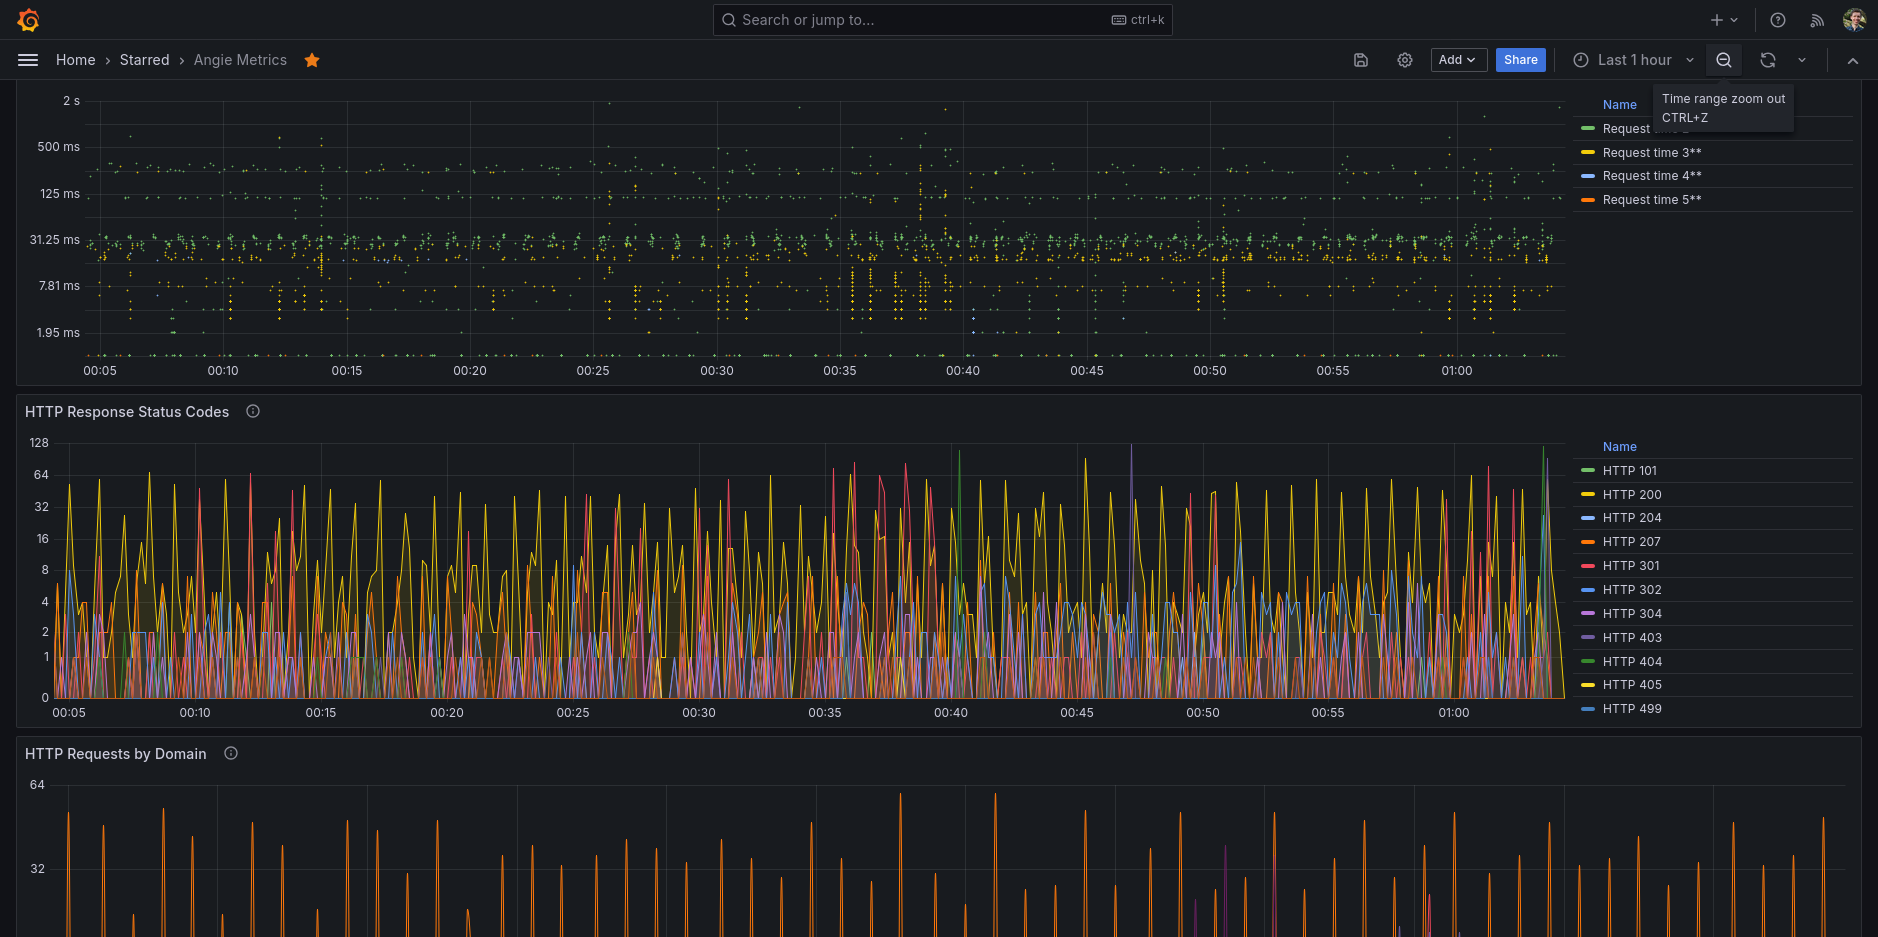
Once you have Angie Telegraf plugin running, the data end-up in your database (eg. InfluxDB). This provided dashboard allows you to see all the information that the status API can provide.
In Angie you will need to:
- Enable the status API in Angie in one of your server directive (see Angie docs)
- Add metrics to your server and/or location and/or upstream directives in Angie (see also Angie docs).
Step 2 is optional, but give you specific metrics for your server on the places you do like to have additional status metrics being reported. The data will then become available on the status API and my Telegraf plugin will use Angie status API to retrieve the data.
Data source config
Collector config:
Upload an updated version of an exported dashboard.json file from Grafana
| Revision | Description | Created | |
|---|---|---|---|
| Download |