
Envoy / Downstream
Detailed downstream connection monitoring for Envoy proxy. Tracks client-facing metrics including request rates, latency percentiles (P50/P95/P99), success rates, active connections, connection lifecycle events, bandwidth usage, and request reset patterns for each HTTP connection manager. Use this dashboard to analyze client behavior, diagnose connection issues, monitor ingress traffic patterns, and identify potential DDoS or abuse scenarios. Supports multi-prefix selection for comparative analysis. The dashboards were generated using [envoy-mixin](https://github.com/adinhodovic/envoy-mixin). Open issues and create feature requests in the repository.
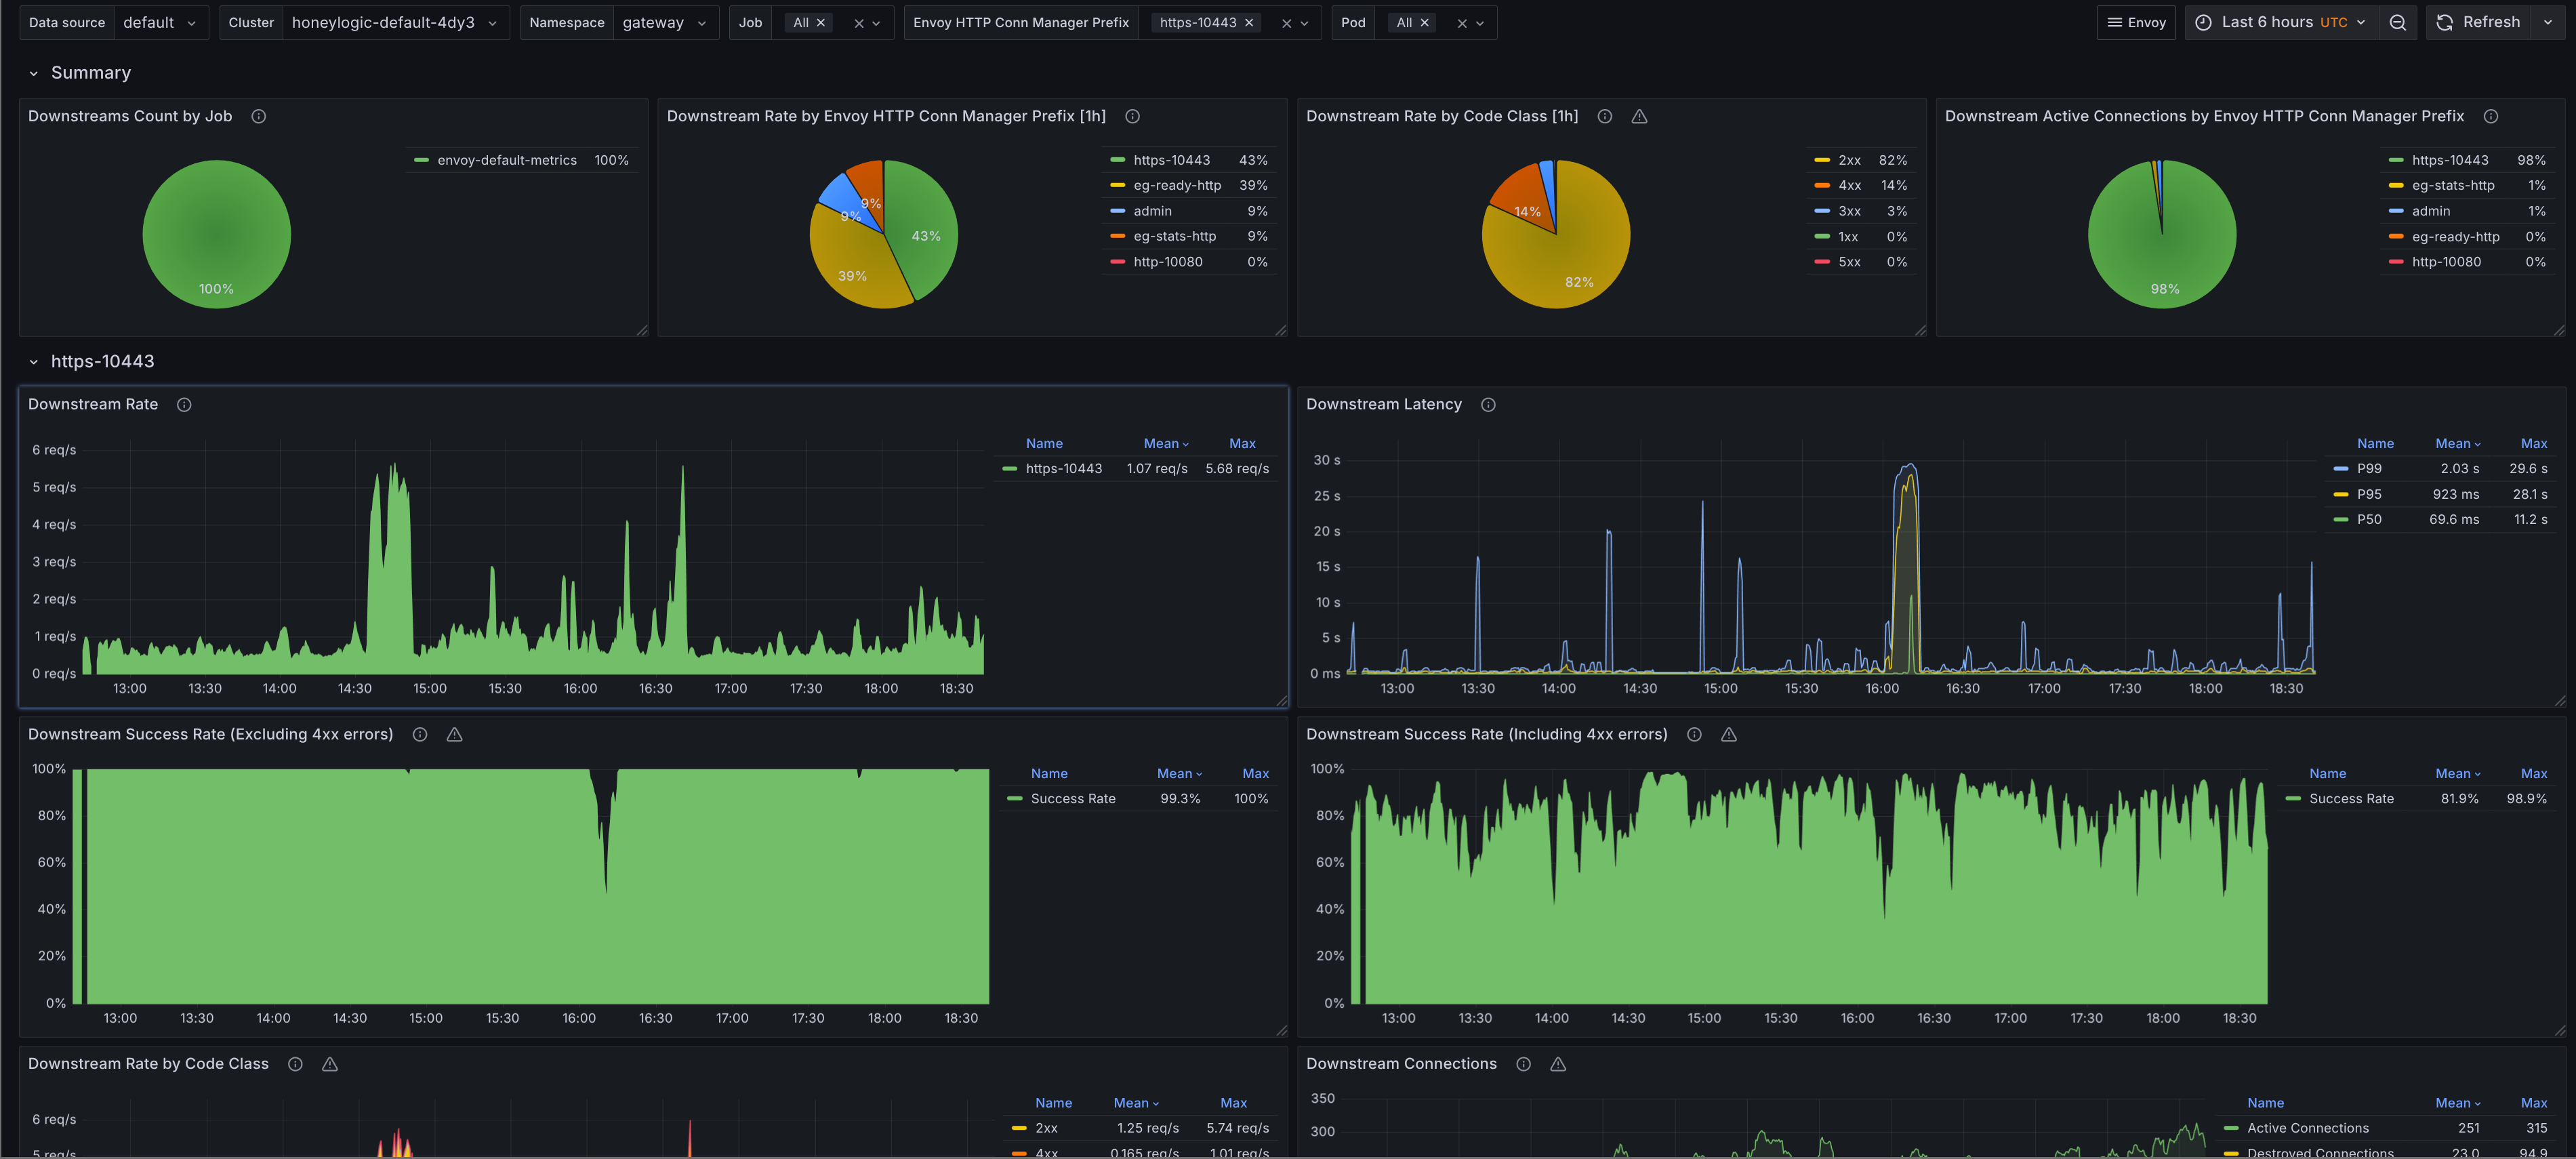
A dashboard that monitors Envoy with a focus on giving an overview of downsreams. The dashboards were generated using envoy-mixin. Open issues and create feature requests in the repository.
Data source config
Collector config:
Upload an updated version of an exported dashboard.json file from Grafana
| Revision | Description | Created | |
|---|---|---|---|
| Download |
Envoy
Easily monitor Envoy, an open source edge and service proxy, designed for cloud-native applications, with Grafana Cloud's out-of-the-box monitoring solution.
Learn more