Umami Business Intelligence
A PostgreSQL-based analytics dashboard for Umami. Includes hourly visit heatmap, 7-day moving averages for referrers and events, qualified-session filtering, and raw KPI summaries for arbitrary time ranges.
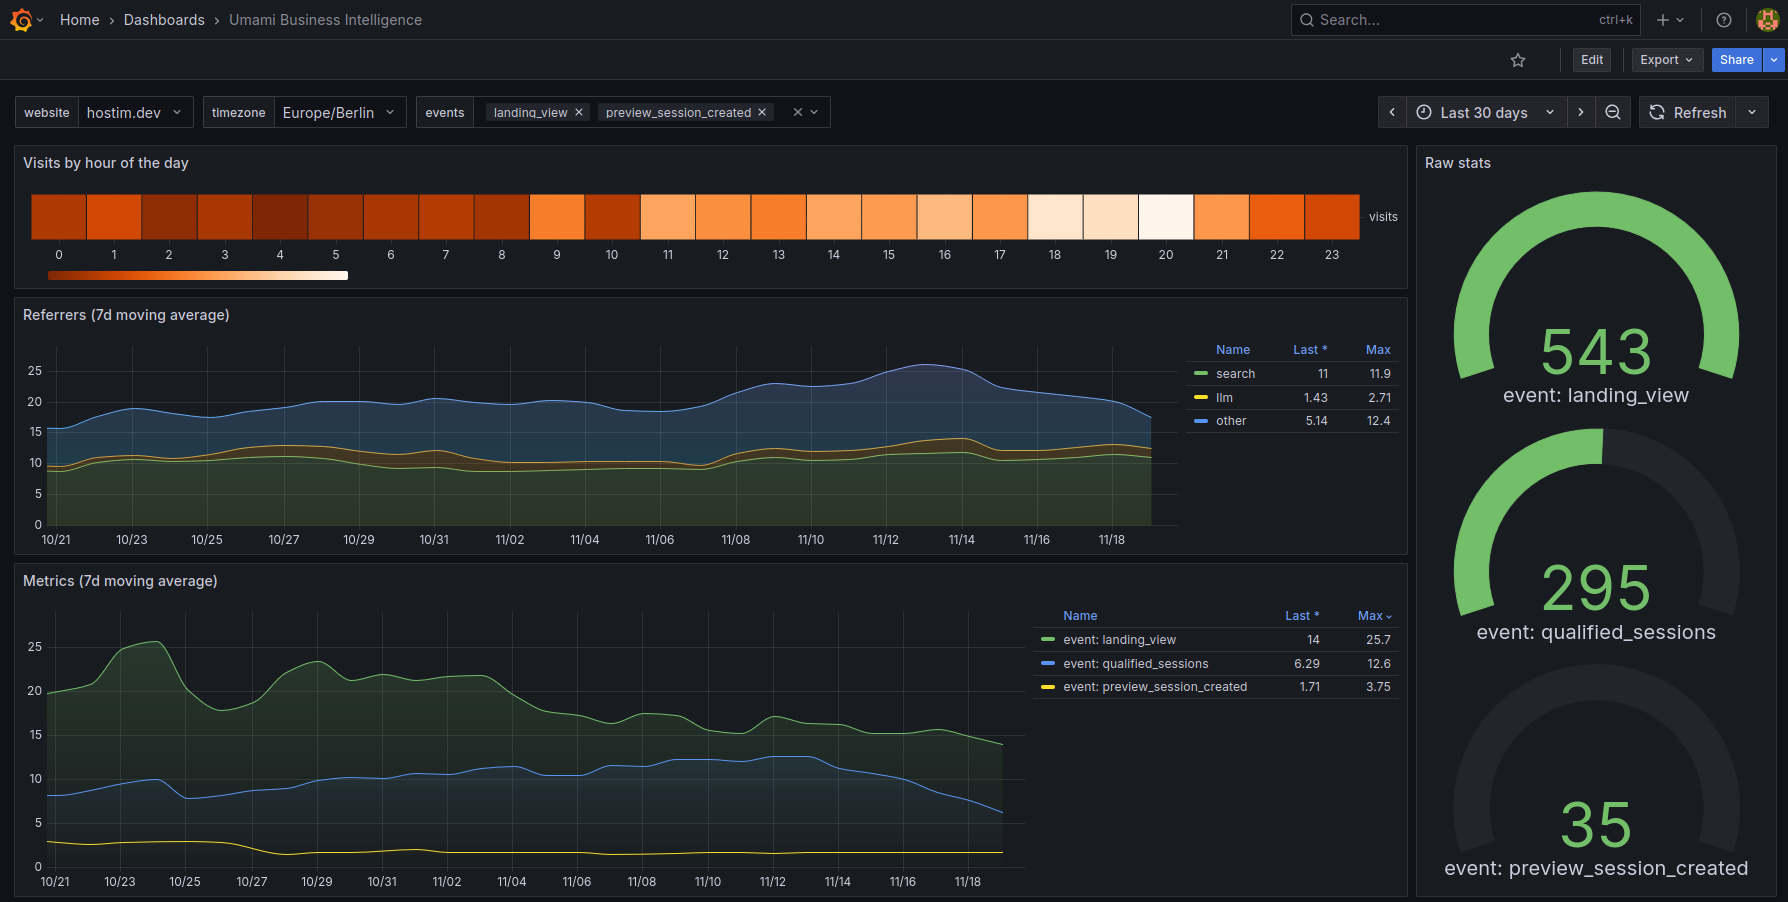
Umami Business Intelligence Dashboard
This dashboard extends Umami Analytics with additional trend and behavior insights using data directly from the Umami PostgreSQL database. It focuses on temporal patterns, source quality, and event-level performance.
Features
Hourly Heatmap
Shows visit distribution by hour of the day to reveal daily traffic patterns and peak activity times.
7-Day Moving Averages
Provides smoother trend visibility for:
- Referrer groups (search, llm, other)
- Custom event metrics
- Qualified sessions (sessions with at least two pageviews)
Qualified Sessions
A derived metric intended to reduce bot noise. Only counts sessions with a minimum of two pageviews.
Raw Metrics Summary
Displays total counts for selected events and metrics over any chosen time range.
Dashboard Variables
- website: Umami website ID
- timezone: used for timestamp conversion
- events: list of custom Umami events available for plotting
Requirements
- Umami Analytics with PostgreSQL
- Grafana 9 or newer
- Network access between Grafana and the Umami PostgreSQL instance
Setup
- Add your Umami PostgreSQL database as a data source in Grafana.
- Set the correct database, user, and password.
- Import the dashboard JSON file.
- Select the PostgreSQL data source when prompted.
Notes
- All queries operate directly on Umami’s
event,session, andwebsitetables. - Referrer groups are computed in SQL using basic pattern matching.
- The dashboard assumes standard Umami schema without modifications.
Data source config
Collector config:
Upload an updated version of an exported dashboard.json file from Grafana
| Revision | Description | Created | |
|---|---|---|---|
| Download |