
Navidrome Observability
Navidrome music server observability dashboard
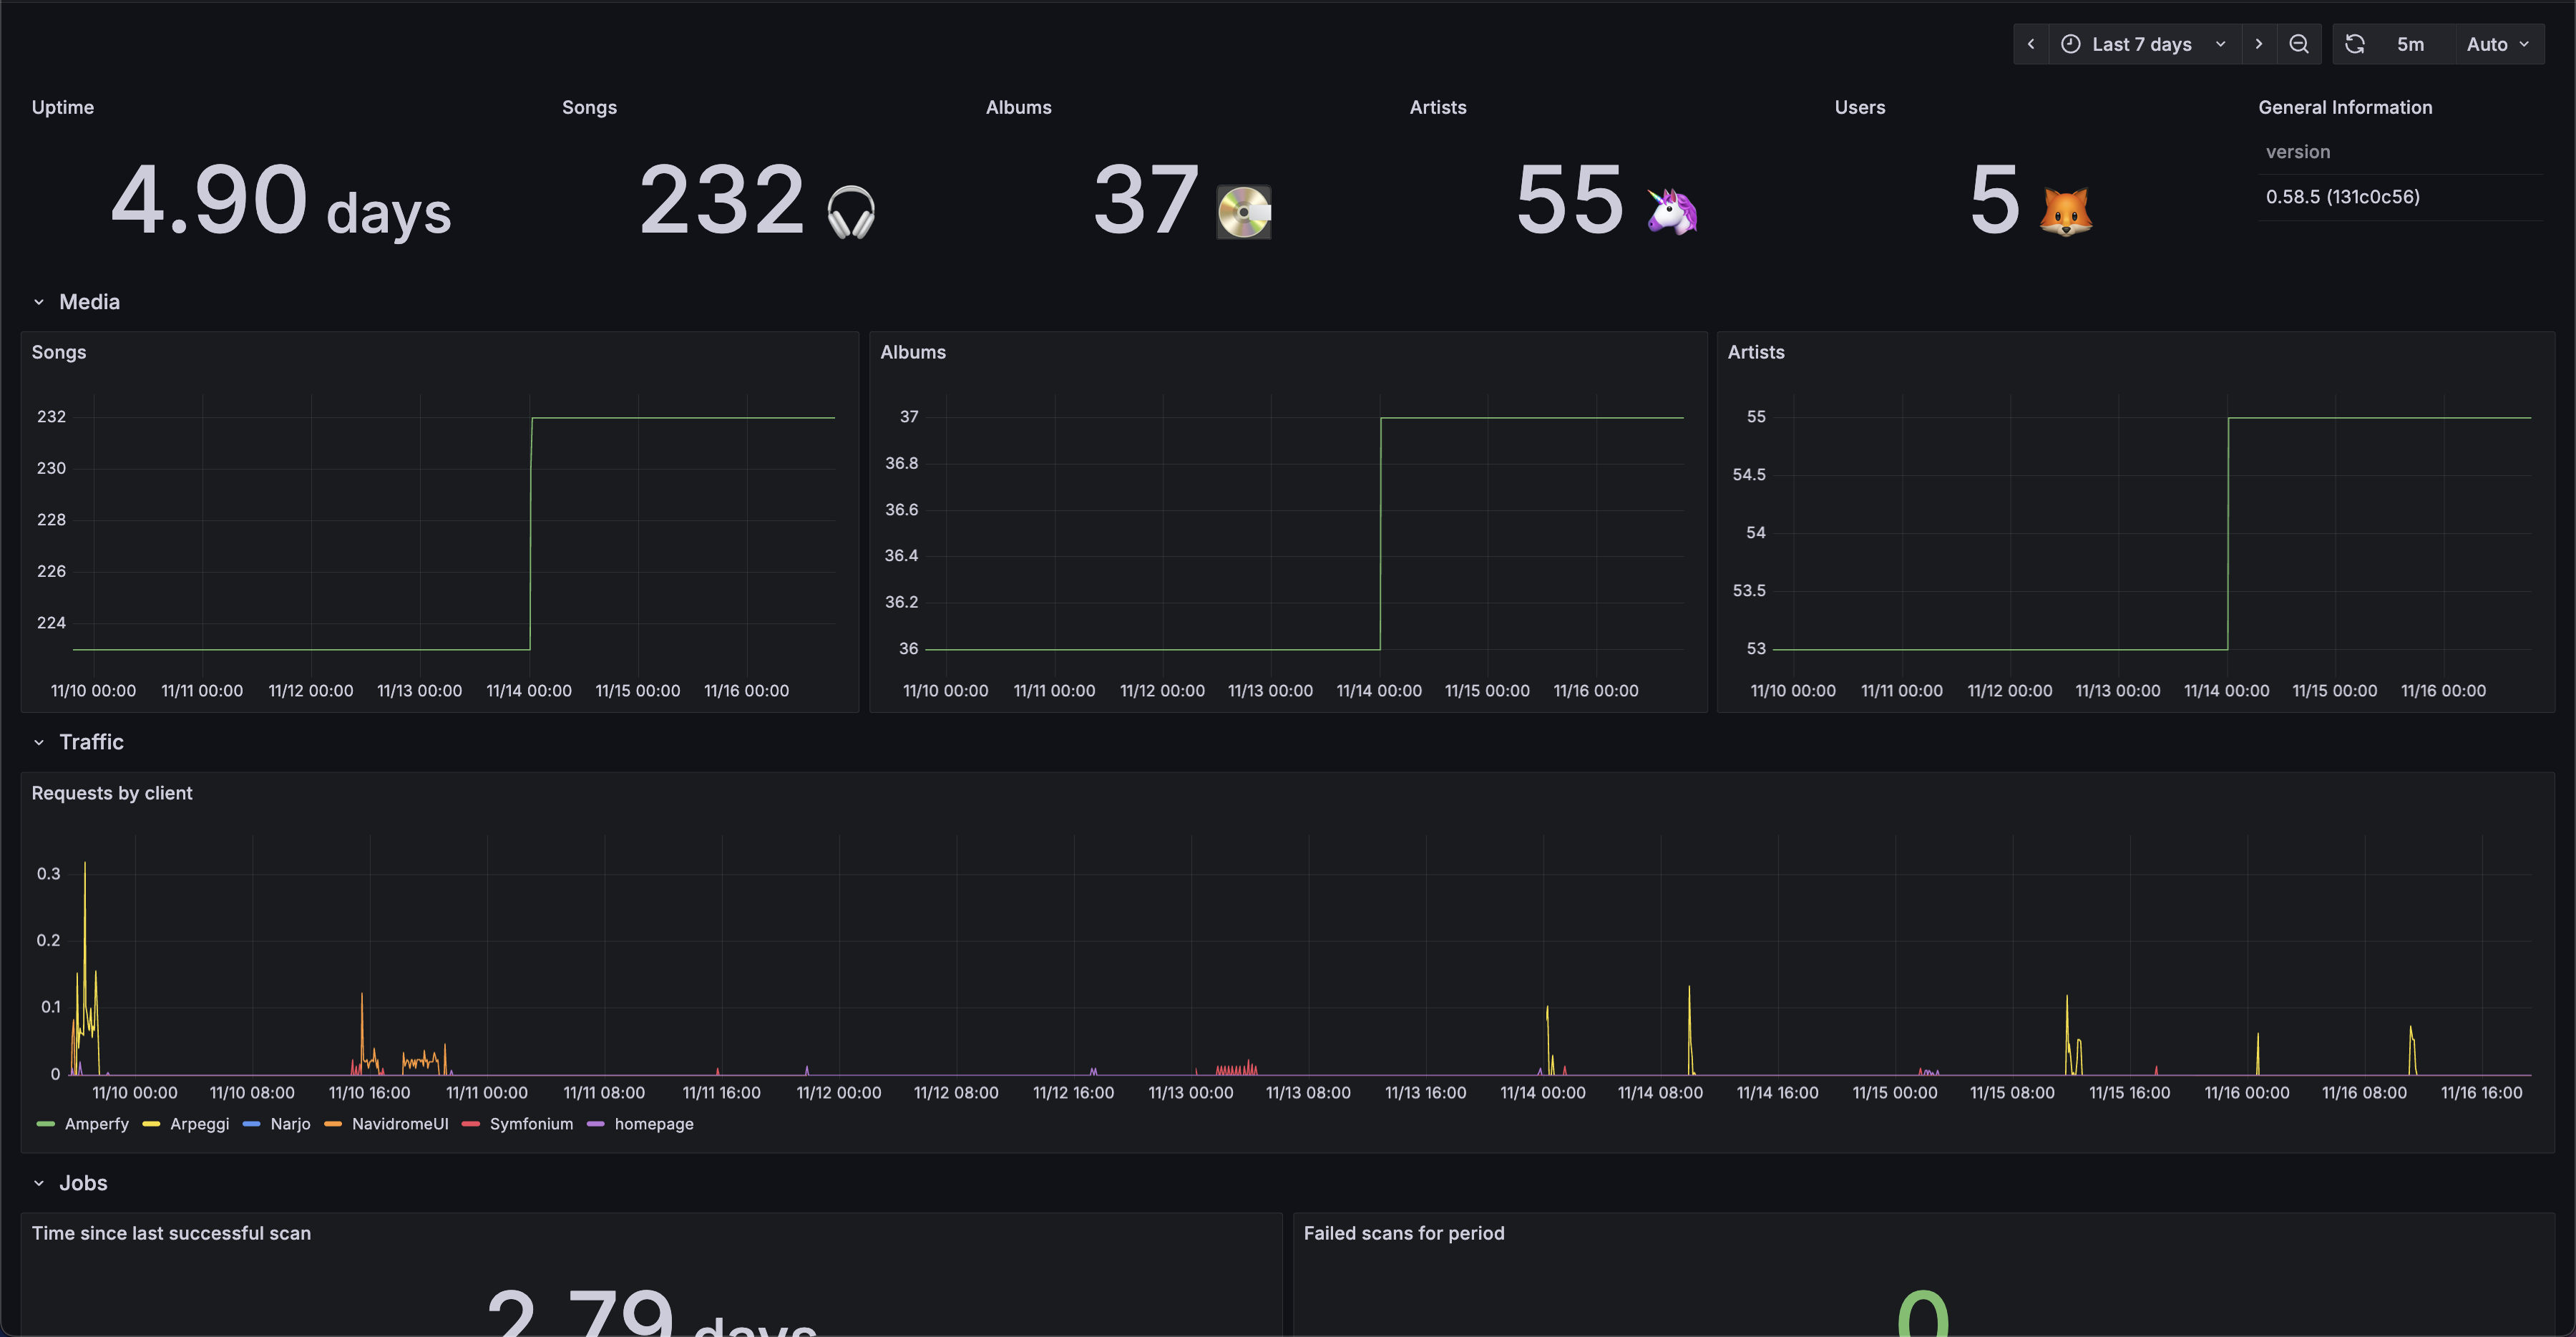
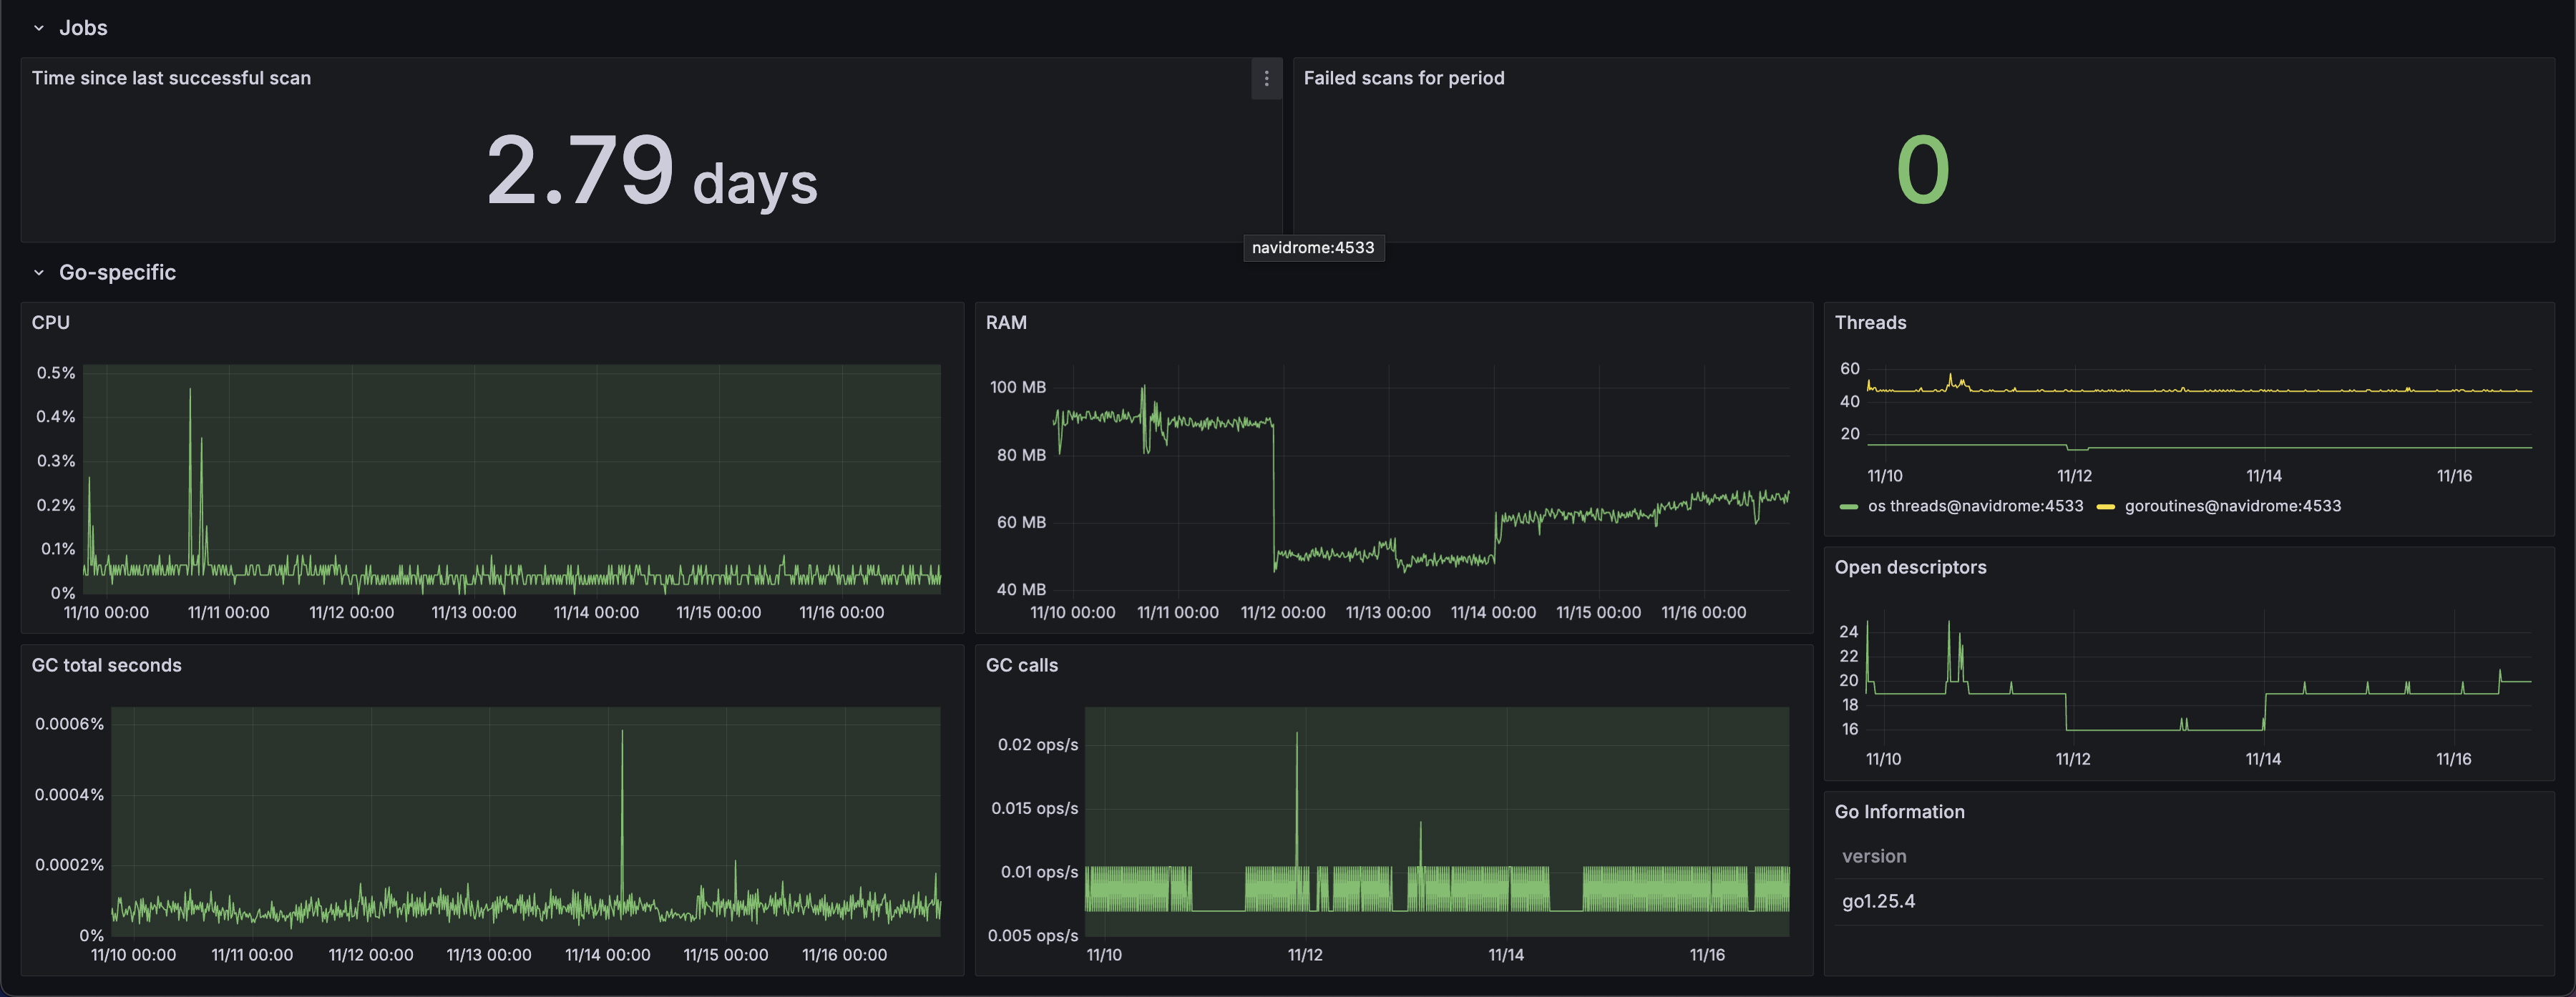
Observability and statistics dashboard for self-hosted Navidrome music servers. The dashboard can be directly integrated with Navidrome metrics collected via Prometheus using the official docs configuration guidelines.
Data source config
Collector type:
Collector plugins:
Collector config:
Revisions
Upload an updated version of an exported dashboard.json file from Grafana
| Revision | Description | Created | |
|---|---|---|---|
| Download |