
Windows Exporter Dashboard 2025
Windows monitoring Dashboard. Compatible with 0.31.3 Rev4: added Job filter to disk graph (Translated StarsL.cn's work. ID: 10467)
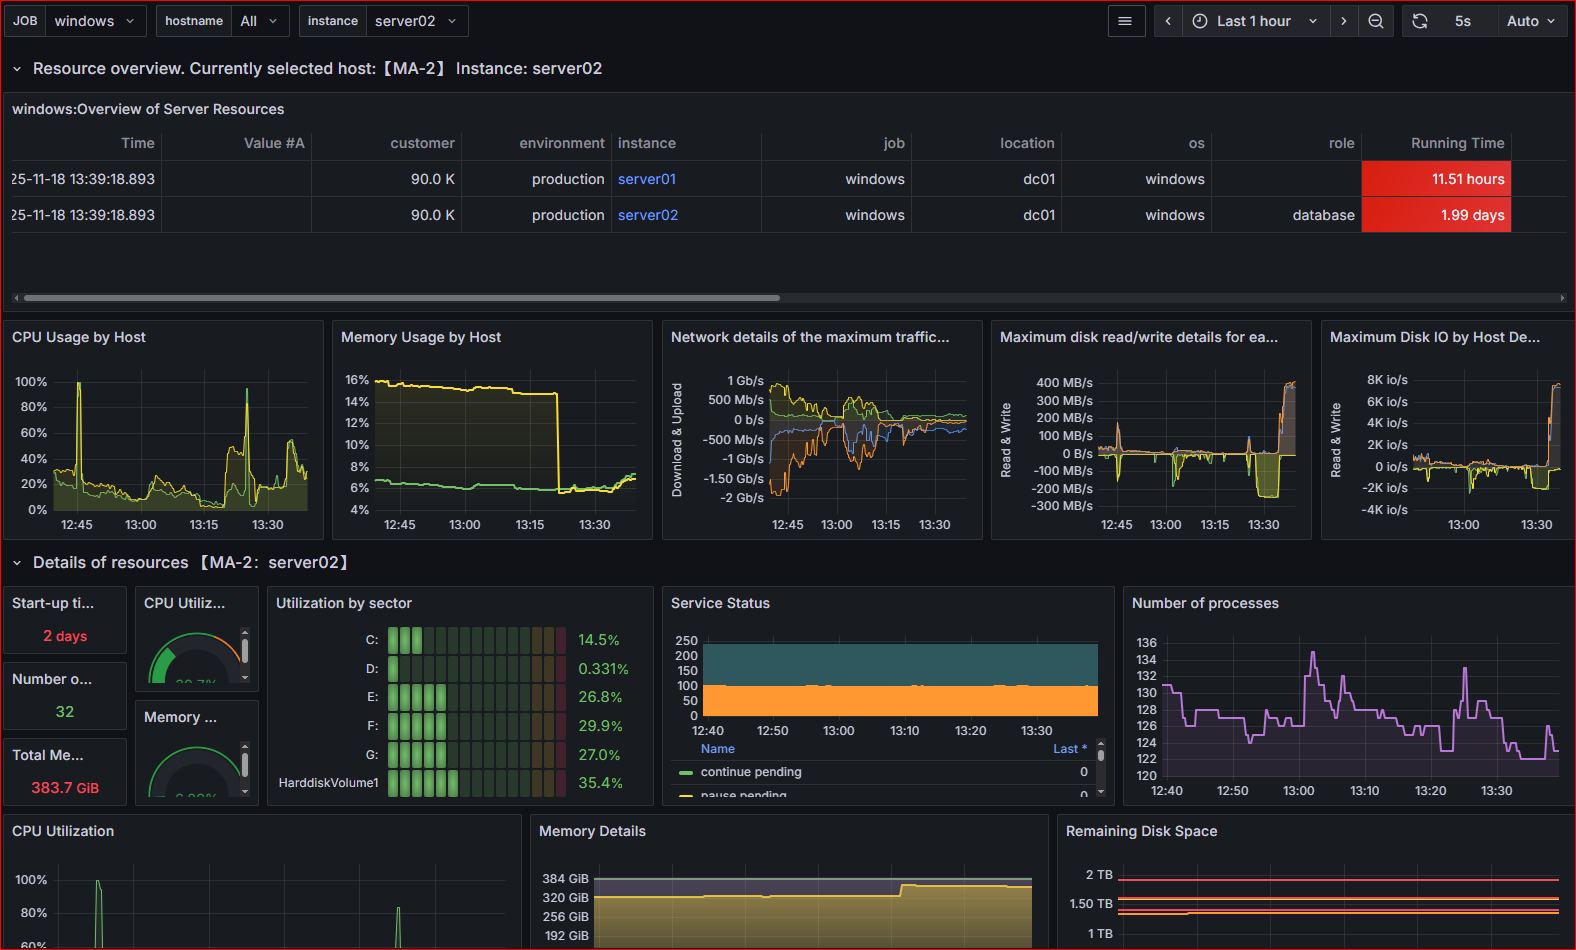
The Windows Exporter Dashboard 2025 dashboard uses the prometheus data source to create a Grafana dashboard with the bargauge, gauge, stat, table and timeseries panels.
Data source config
Collector type:
Collector plugins:
Collector config:
Revisions
Upload an updated version of an exported dashboard.json file from Grafana
| Revision | Description | Created | |
|---|---|---|---|
| Download |
Windows
Easily monitor your deployment of the Windows operating system with Grafana Cloud's out-of-the-box monitoring solution.
Learn more