
Rocket Data Gateway Stack Monitoring V1.0.0
This sample Grafana dashboard is created to monitor Rocket Data Gateway stack. Dashboard is focusing on main metrics that allow to verify that RDG stack is running properly and is in good state.
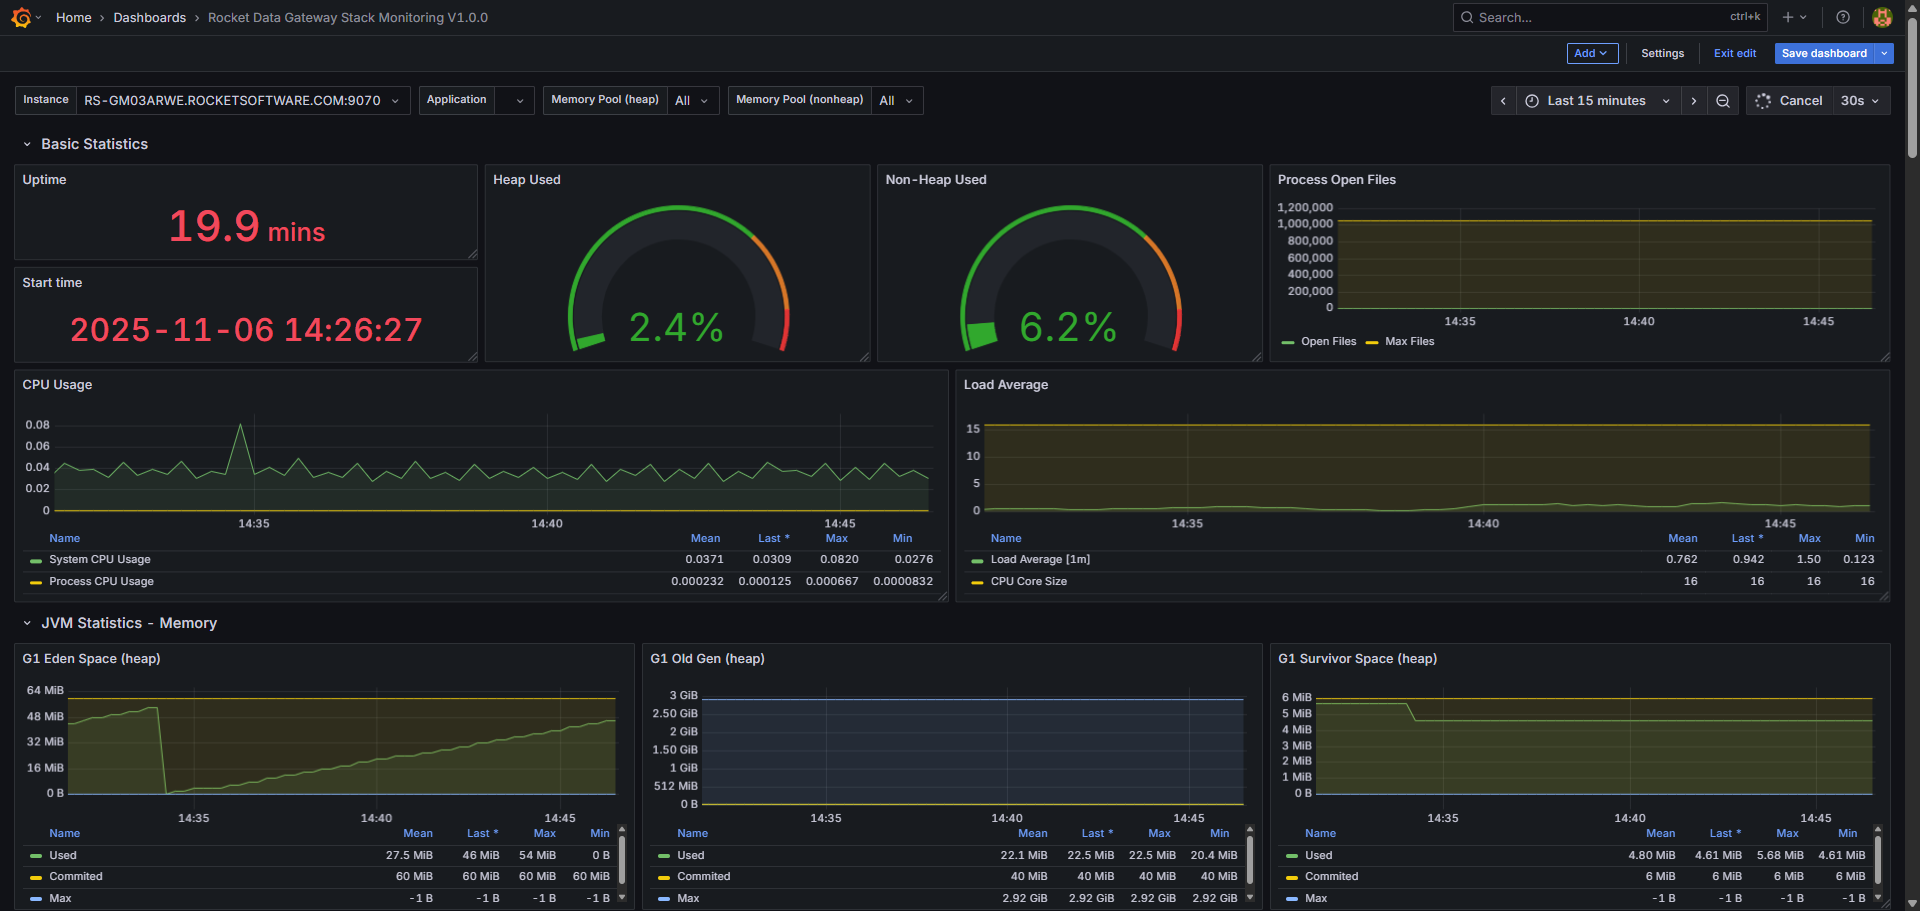
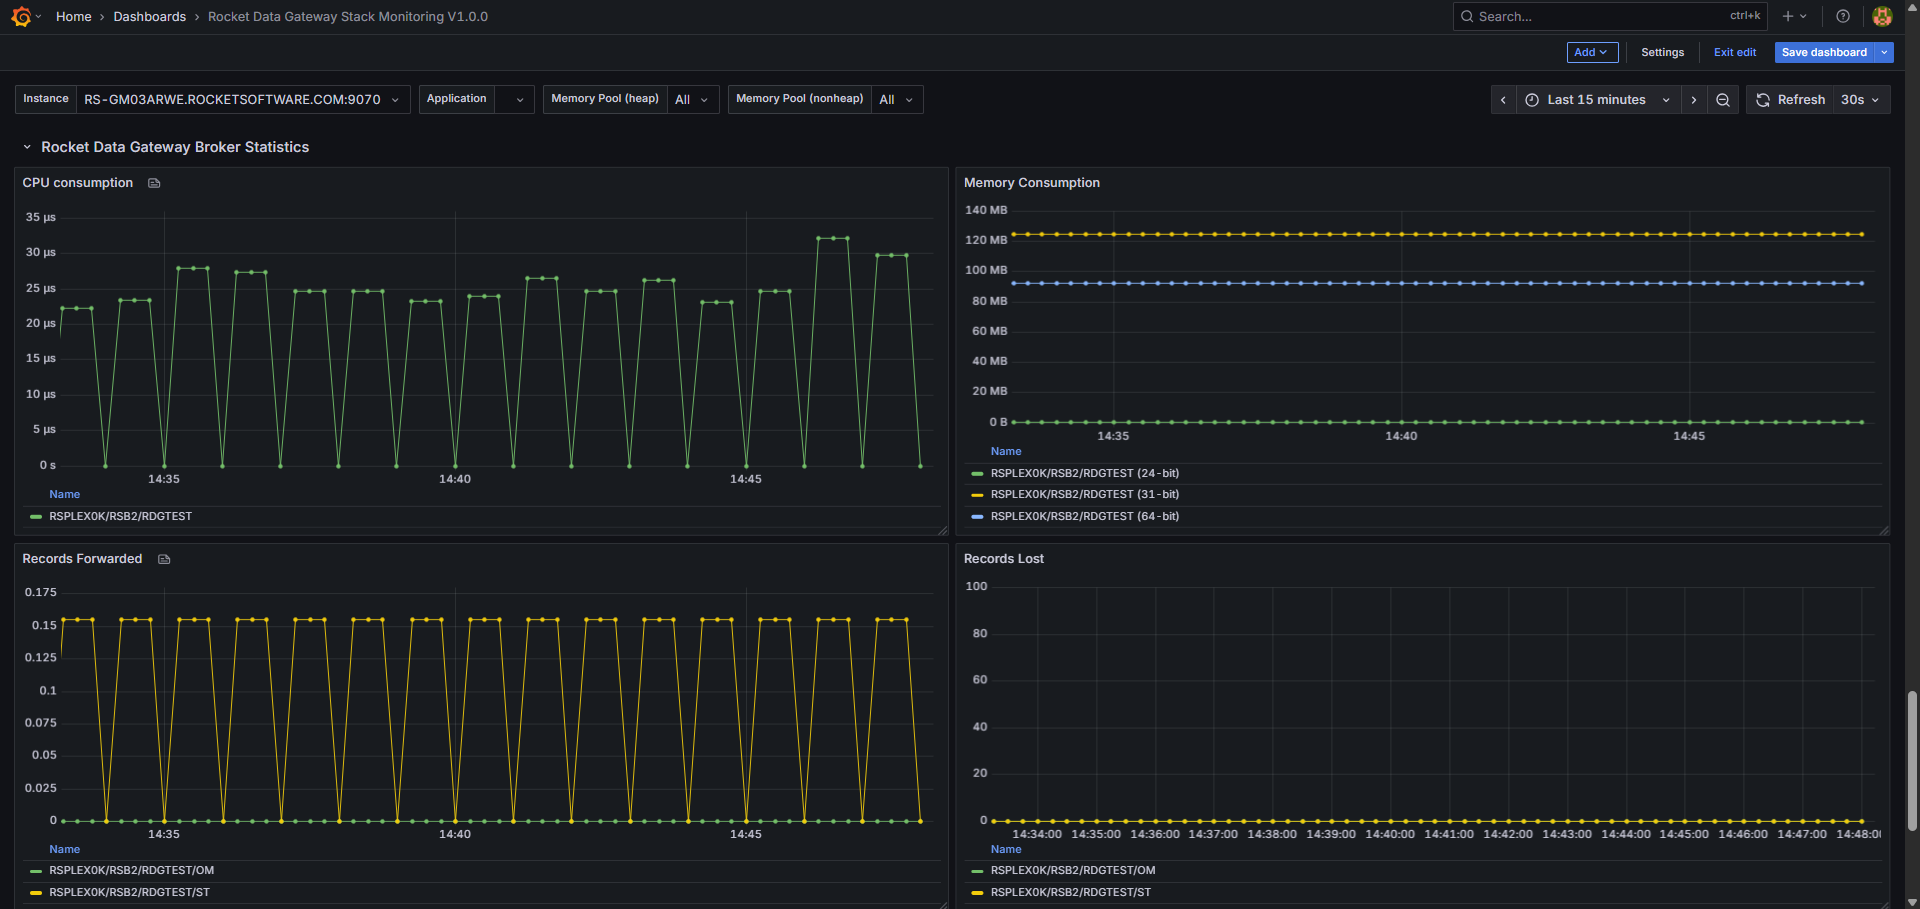
The Rocket Data Gateway Stack Monitoring V1.0.0 dashboard uses the prometheus data source to create a Grafana dashboard with the bargauge, gauge, stat and timeseries panels.
Data source config
Collector type:
Collector plugins:
Collector config:
Revisions
Upload an updated version of an exported dashboard.json file from Grafana
| Revision | Description | Created | |
|---|---|---|---|
| Download |