
Filebeat
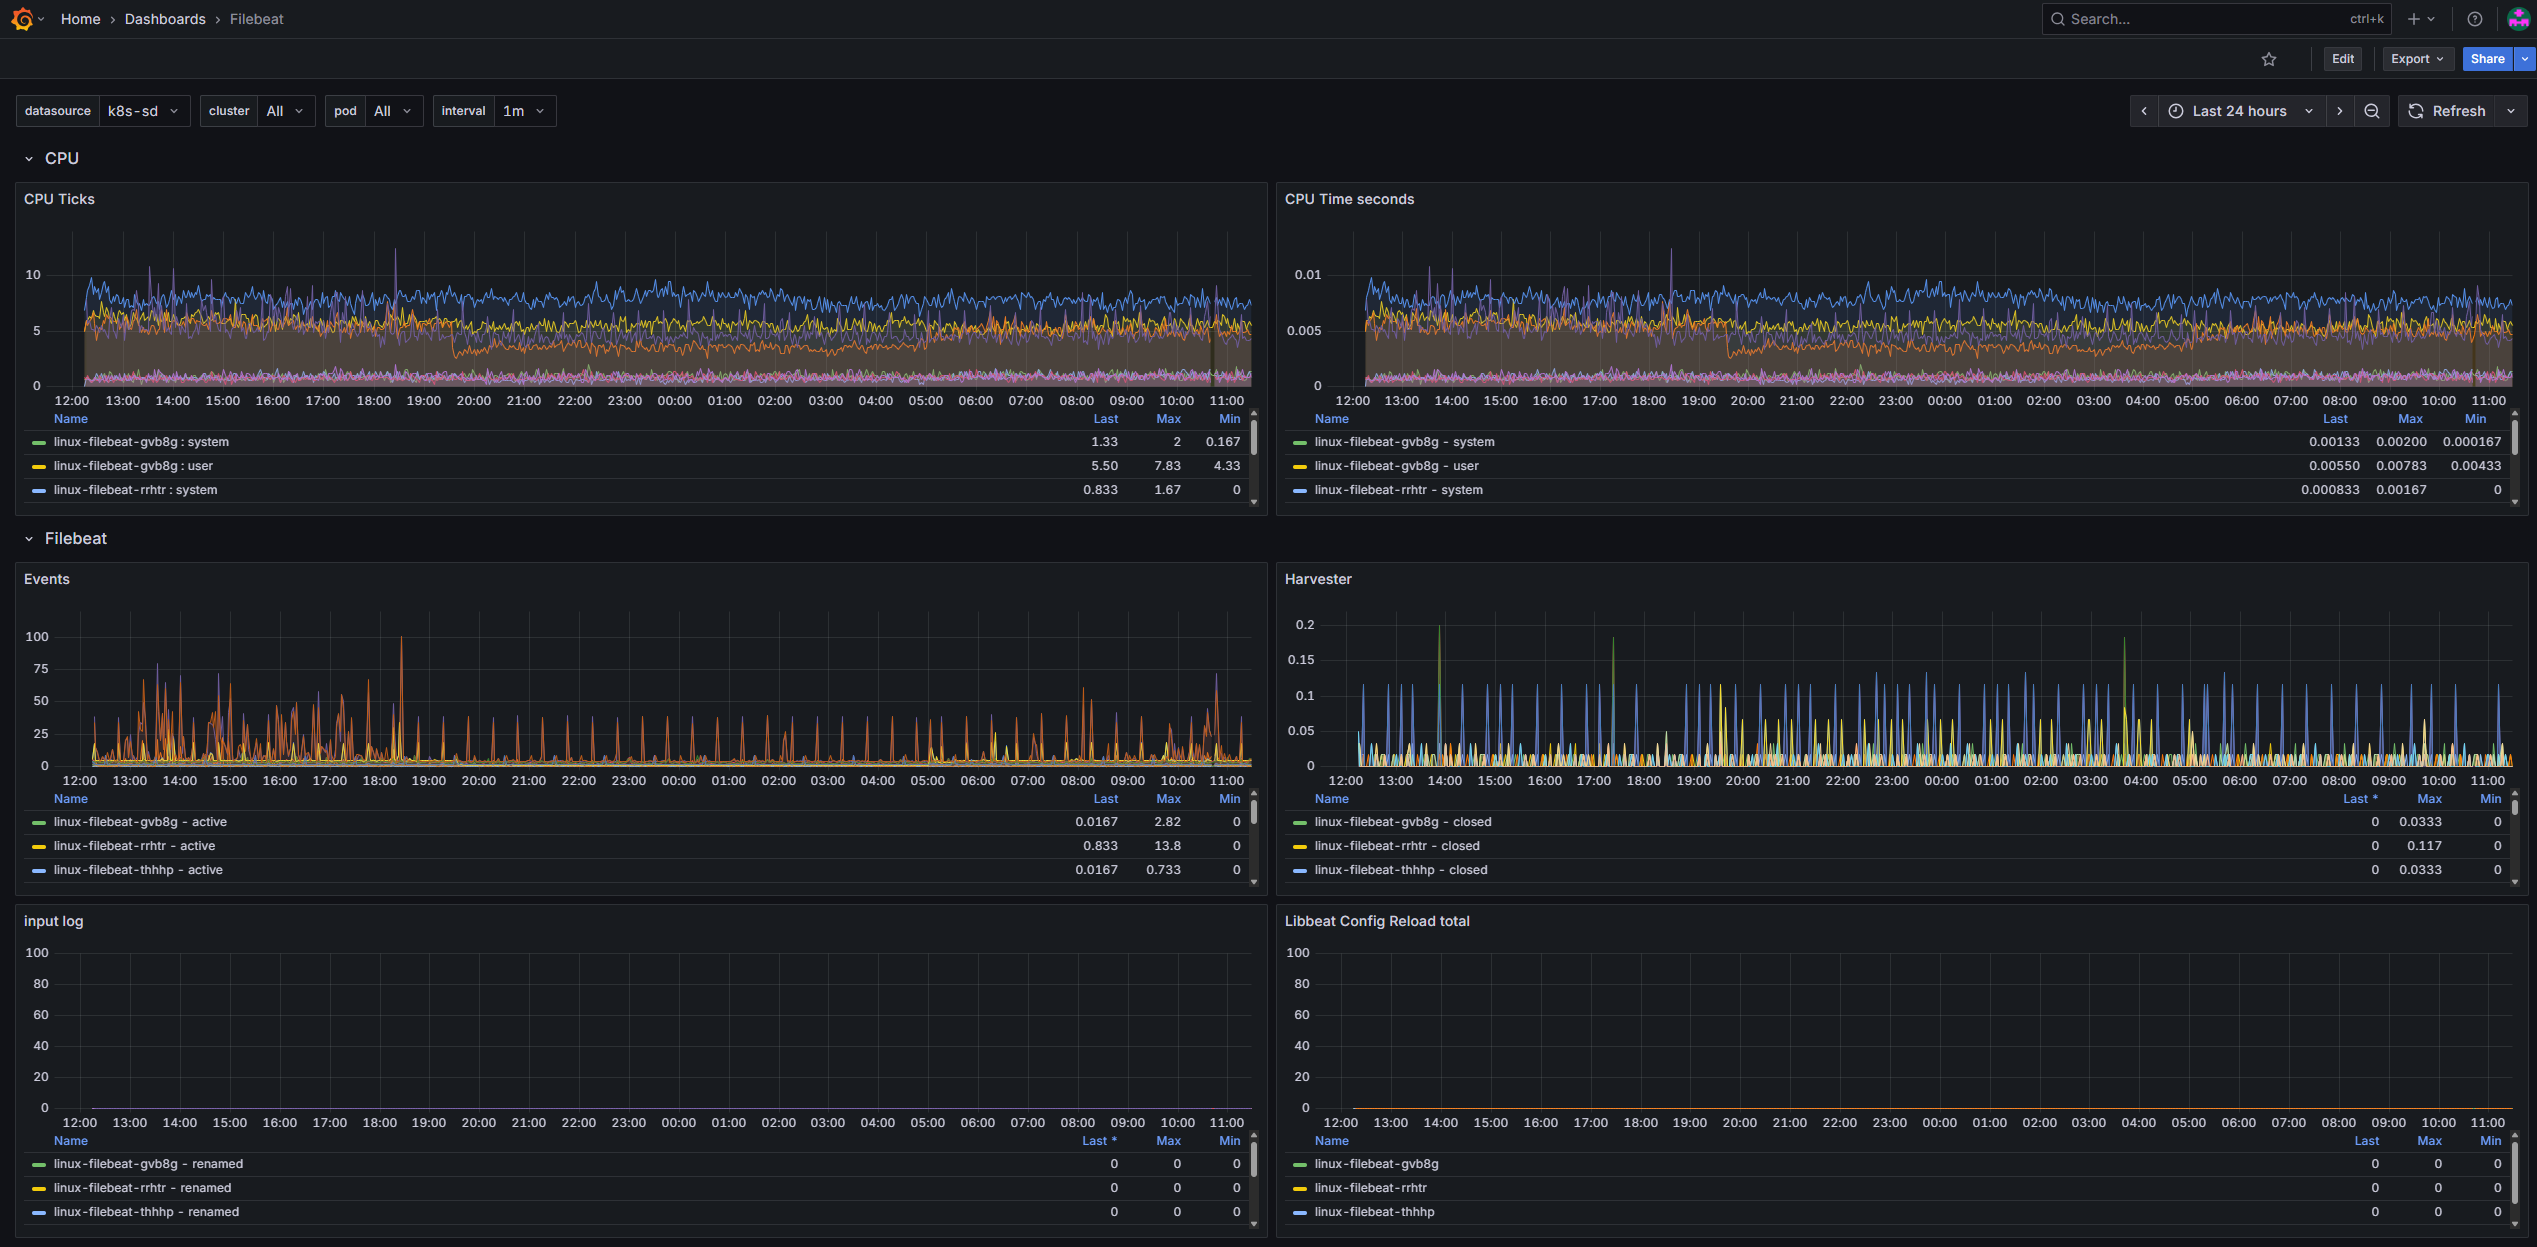
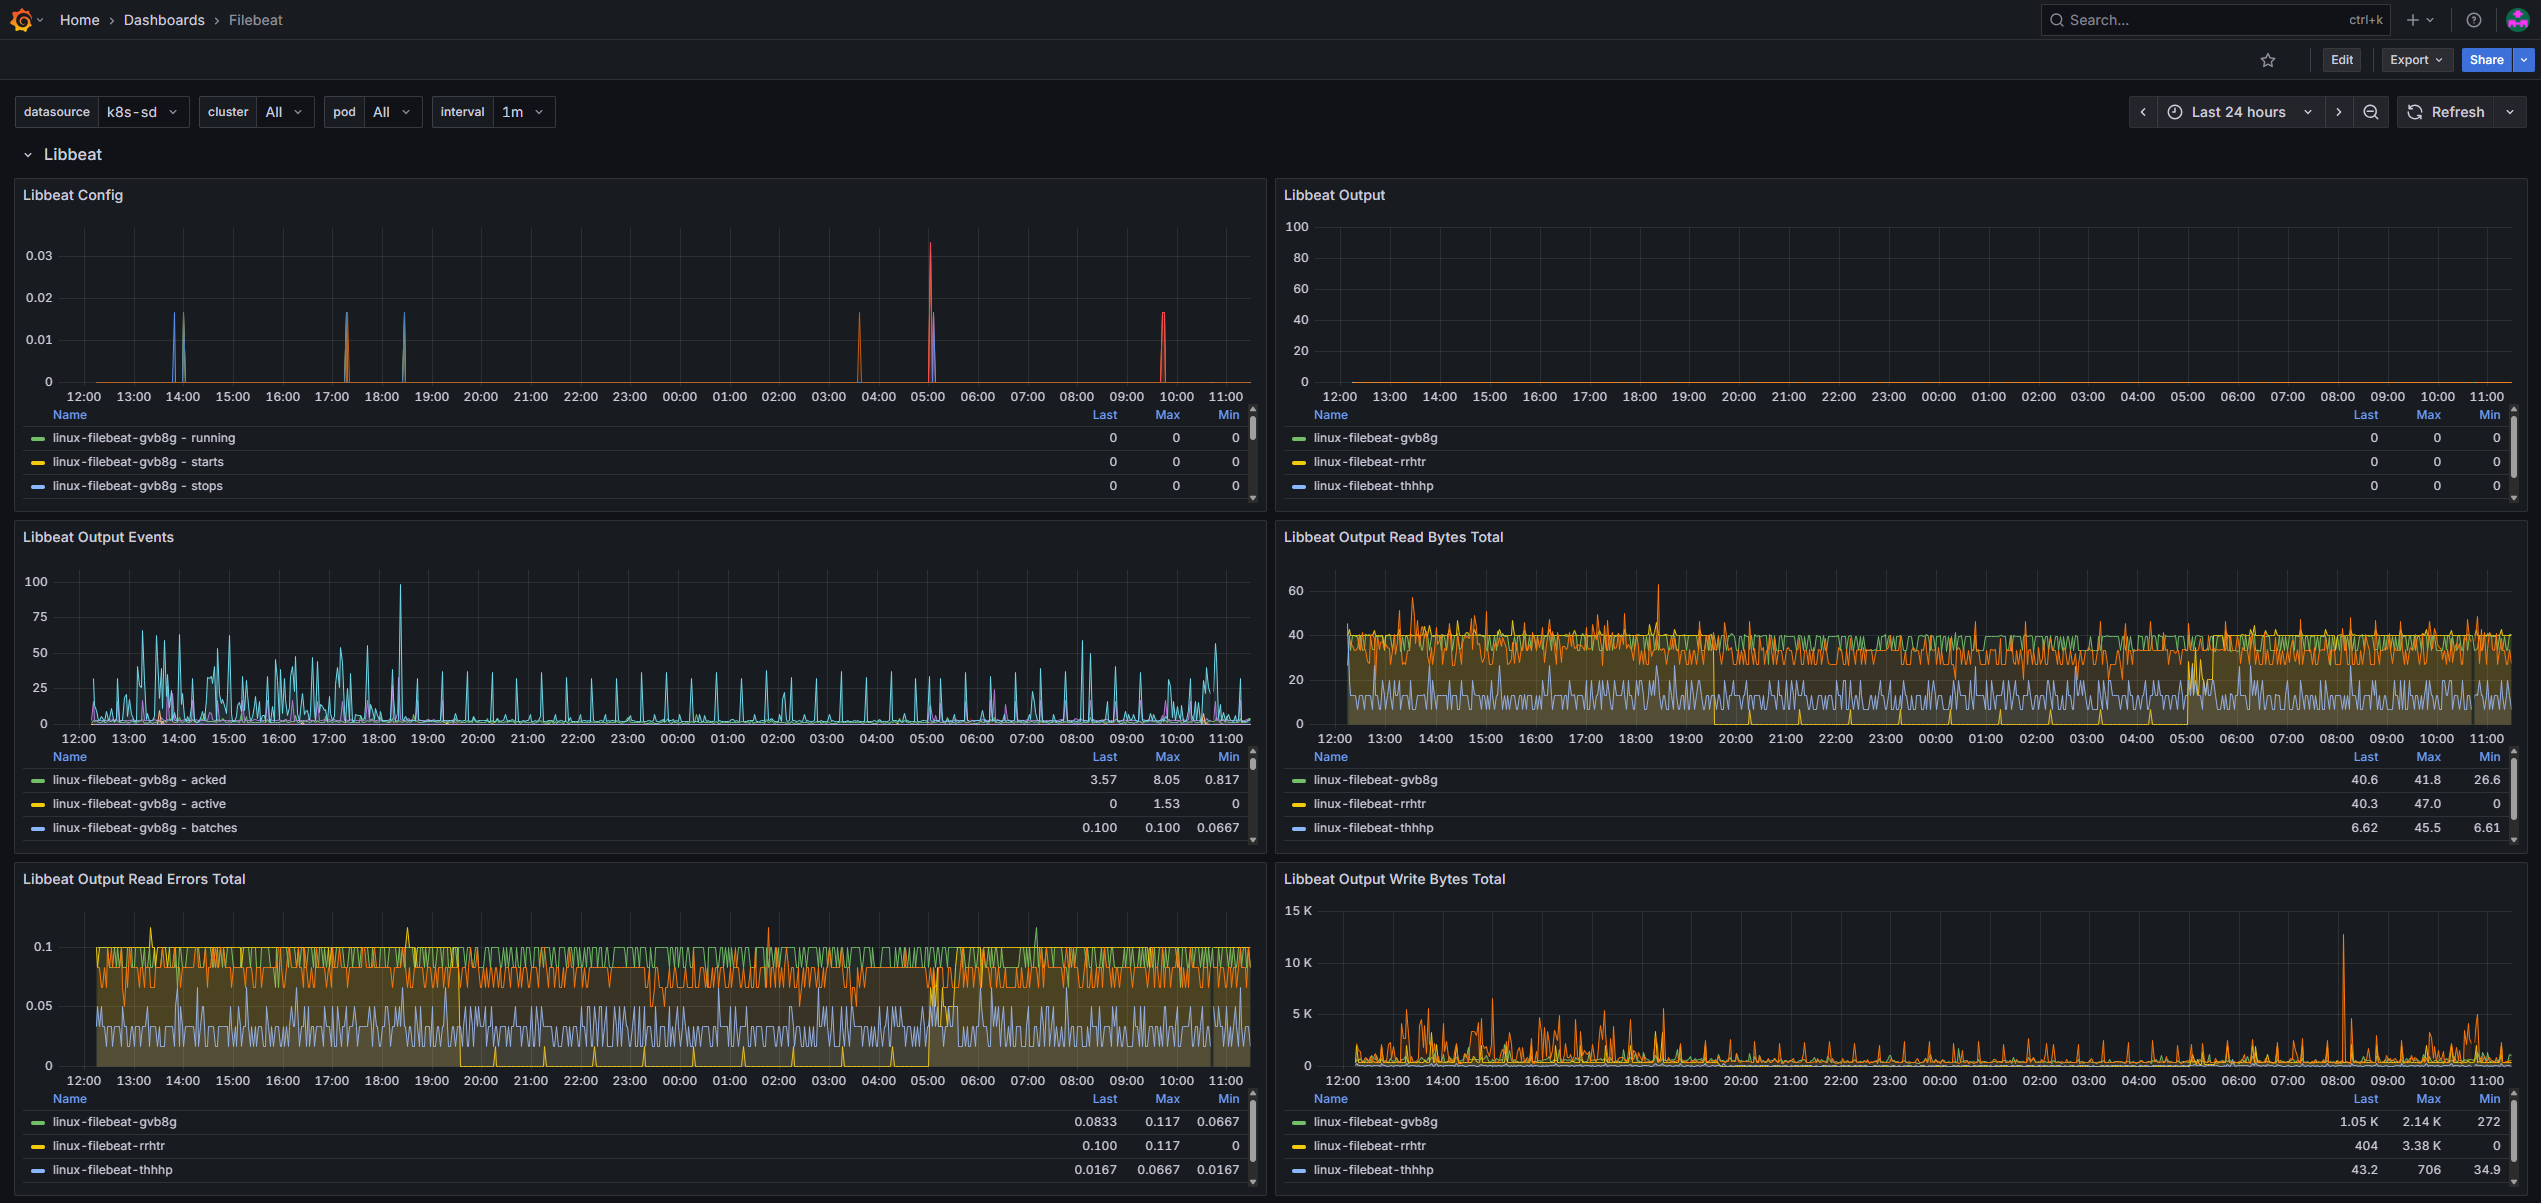
Dashboard for Filebeat metrics from Prometheus. Requires https://github.com/dimuskin/beat-exporter/
Filebeat — Grafana Dashboard
This dashboard visualizes Filebeat metrics exported by the beat-exporter sidecar and scraped by Prometheus.
It’s compatible with Grafana 9/10/11/12 (uses panels[], gridPos, timeseries, schemaVersion >= 38).
Data source config
Collector type:
Collector plugins:
Collector config:
Revisions
Upload an updated version of an exported dashboard.json file from Grafana
| Revision | Description | Created | |
|---|---|---|---|
| Download |