
RabbitAssets
Asset price monitoring system
RabbitAssets 🐰📈
A high-performance asset price monitoring system built with Bun that tracks cryptocurrency, stock, and fiat currency prices across multiple exchanges and exports metrics in OpenMetrics format for Prometheus.
Features
- 🚀 Blazing Fast - Built with Bun for optimal performance
- 📊 Multi-Exchange Support - Binance, Kraken, Coinbase, RabbitStocks, and Fiat currencies
- 🌍 Multi-Currency Portfolio - Automatic currency conversion with real-time forex rates
- 🎯 OpenMetrics Export - Prometheus-compatible metrics endpoint
- 🔄 Real-time Updates - WebSocket connections for live price updates
- 👥 Multi-Owner Support - Track assets for multiple portfolio owners
- 🐳 Docker Ready - Easy deployment with Docker and Docker Compose
- 🔐 Bearer Authentication - Optional token-based API security
- 📈 Portfolio Analytics - Value breakdowns, currency distribution, and asset percentages
Supported Exchanges
- RabbitStocks - Stock market data
- Binance - Cryptocurrency prices via WebSocket
- Kraken - Cryptocurrency prices via WebSocket
- Coinbase - Cryptocurrency prices via WebSocket
- Fiat - Forex currency conversion rates
Quick Start
Prerequisites
Docker and Docker Compose
Configuration
Create a config.json file:
{
	"server": {
		"host": "0.0.0.0",
		"port": 3000,
		"token": null
	},
	"logger": {
		"level": 3
	},
	"assets": [
		{
			"symbol": "EUR",
			"quantity": 1500,
			"exchange": "fiat",
			"currency": "USD",
			"owner": "default"
		},
		{
			"symbol": "EUR",
			"quantity": 430,
			"exchange": "fiat",
			"currency": "EUR",
			"owner": "ziga"
		},
		{
			"symbol": "UBNT",
			"quantity": 3.624,
			"exchange": "rabbitstocks",
			"currency": "EUR",
			"owner": "default"
		},
		{
			"symbol": "UBNT",
			"quantity": 1.31,
			"exchange": "rabbitstocks",
			"currency": "EUR",
			"owner": "ziga"
		},
		{
			"symbol": "NET",
			"quantity": 4.5,
			"exchange": "rabbitstocks",
			"currency": "EUR",
			"owner": "default"
		},
		{
			"symbol": "WISEl",
			"quantity": 4,
			"exchange": "rabbitstocks",
			"currency": "EUR",
			"owner": "default"
		},
		{
			"symbol": "BTC",
			"quantity": 0.043212,
			"exchange": "binance",
			"currency": "USD",
			"owner": "default"
		},
		{
			"symbol": "BTC",
			"quantity": 0.0003167,
			"exchange": "binance",
			"currency": "USD",
			"owner": "ziga"
		},
		{
			"symbol": "ETH",
			"quantity": 0.64232,
			"exchange": "coinbase",
			"currency": "USD",
			"owner": "default"
		},
		{
			"symbol": "SOL",
			"quantity": 0.16,
			"exchange": "coinbase",
			"currency": "USD",
			"owner": "default"
		},
		{
			"symbol": "XMR",
			"quantity": 2.54,
			"exchange": "kraken",
			"currency": "USD",
			"owner": "default"
		}
	]
}
Running with Docker Compose
Create docker-compose.yml file:
services:
  rabbitassets:
    image: rabbitcompany/rabbitassets:latest
    container_name: rabbitassets
    restart: unless-stopped
    ports:
      - "3000:3000"
    volumes:
      - ./config.json:/usr/src/app/config.json
    healthcheck:
      test: ["CMD", "curl", "-f", "http://localhost:3000/health"]
      interval: 10s
      timeout: 3s
      retries: 3
      start_period: 5s
Start the project with:
docker-compose up -d
Manual Docker Run
docker run -d \
  --name rabbitassets \
  -p 3000:3000 \
  -v $(pwd)/config.json:/usr/src/app/config.json \
  rabbitcompany/rabbitassets:latest
API Endpoints
GET /health
API endpoint for checking project health
GET /metrics
OpenMetrics format endpoint for Prometheus scraping.
GET /v1/assets
JSON API endpoint returning all asset metrics.
Example response:
[
	{
		"symbol": "BTC",
		"quantity": 0.043212,
		"currentPrice": 45000.5,
		"value": 1944.56,
		"currency": "USD",
		"exchange": "binance",
		"owner": "default"
	},
	{
		"symbol": "ETH",
		"quantity": 0.64232,
		"currentPrice": 2500.75,
		"value": 1605.48,
		"currency": "USD",
		"exchange": "binance",
		"owner": "default"
	}
]
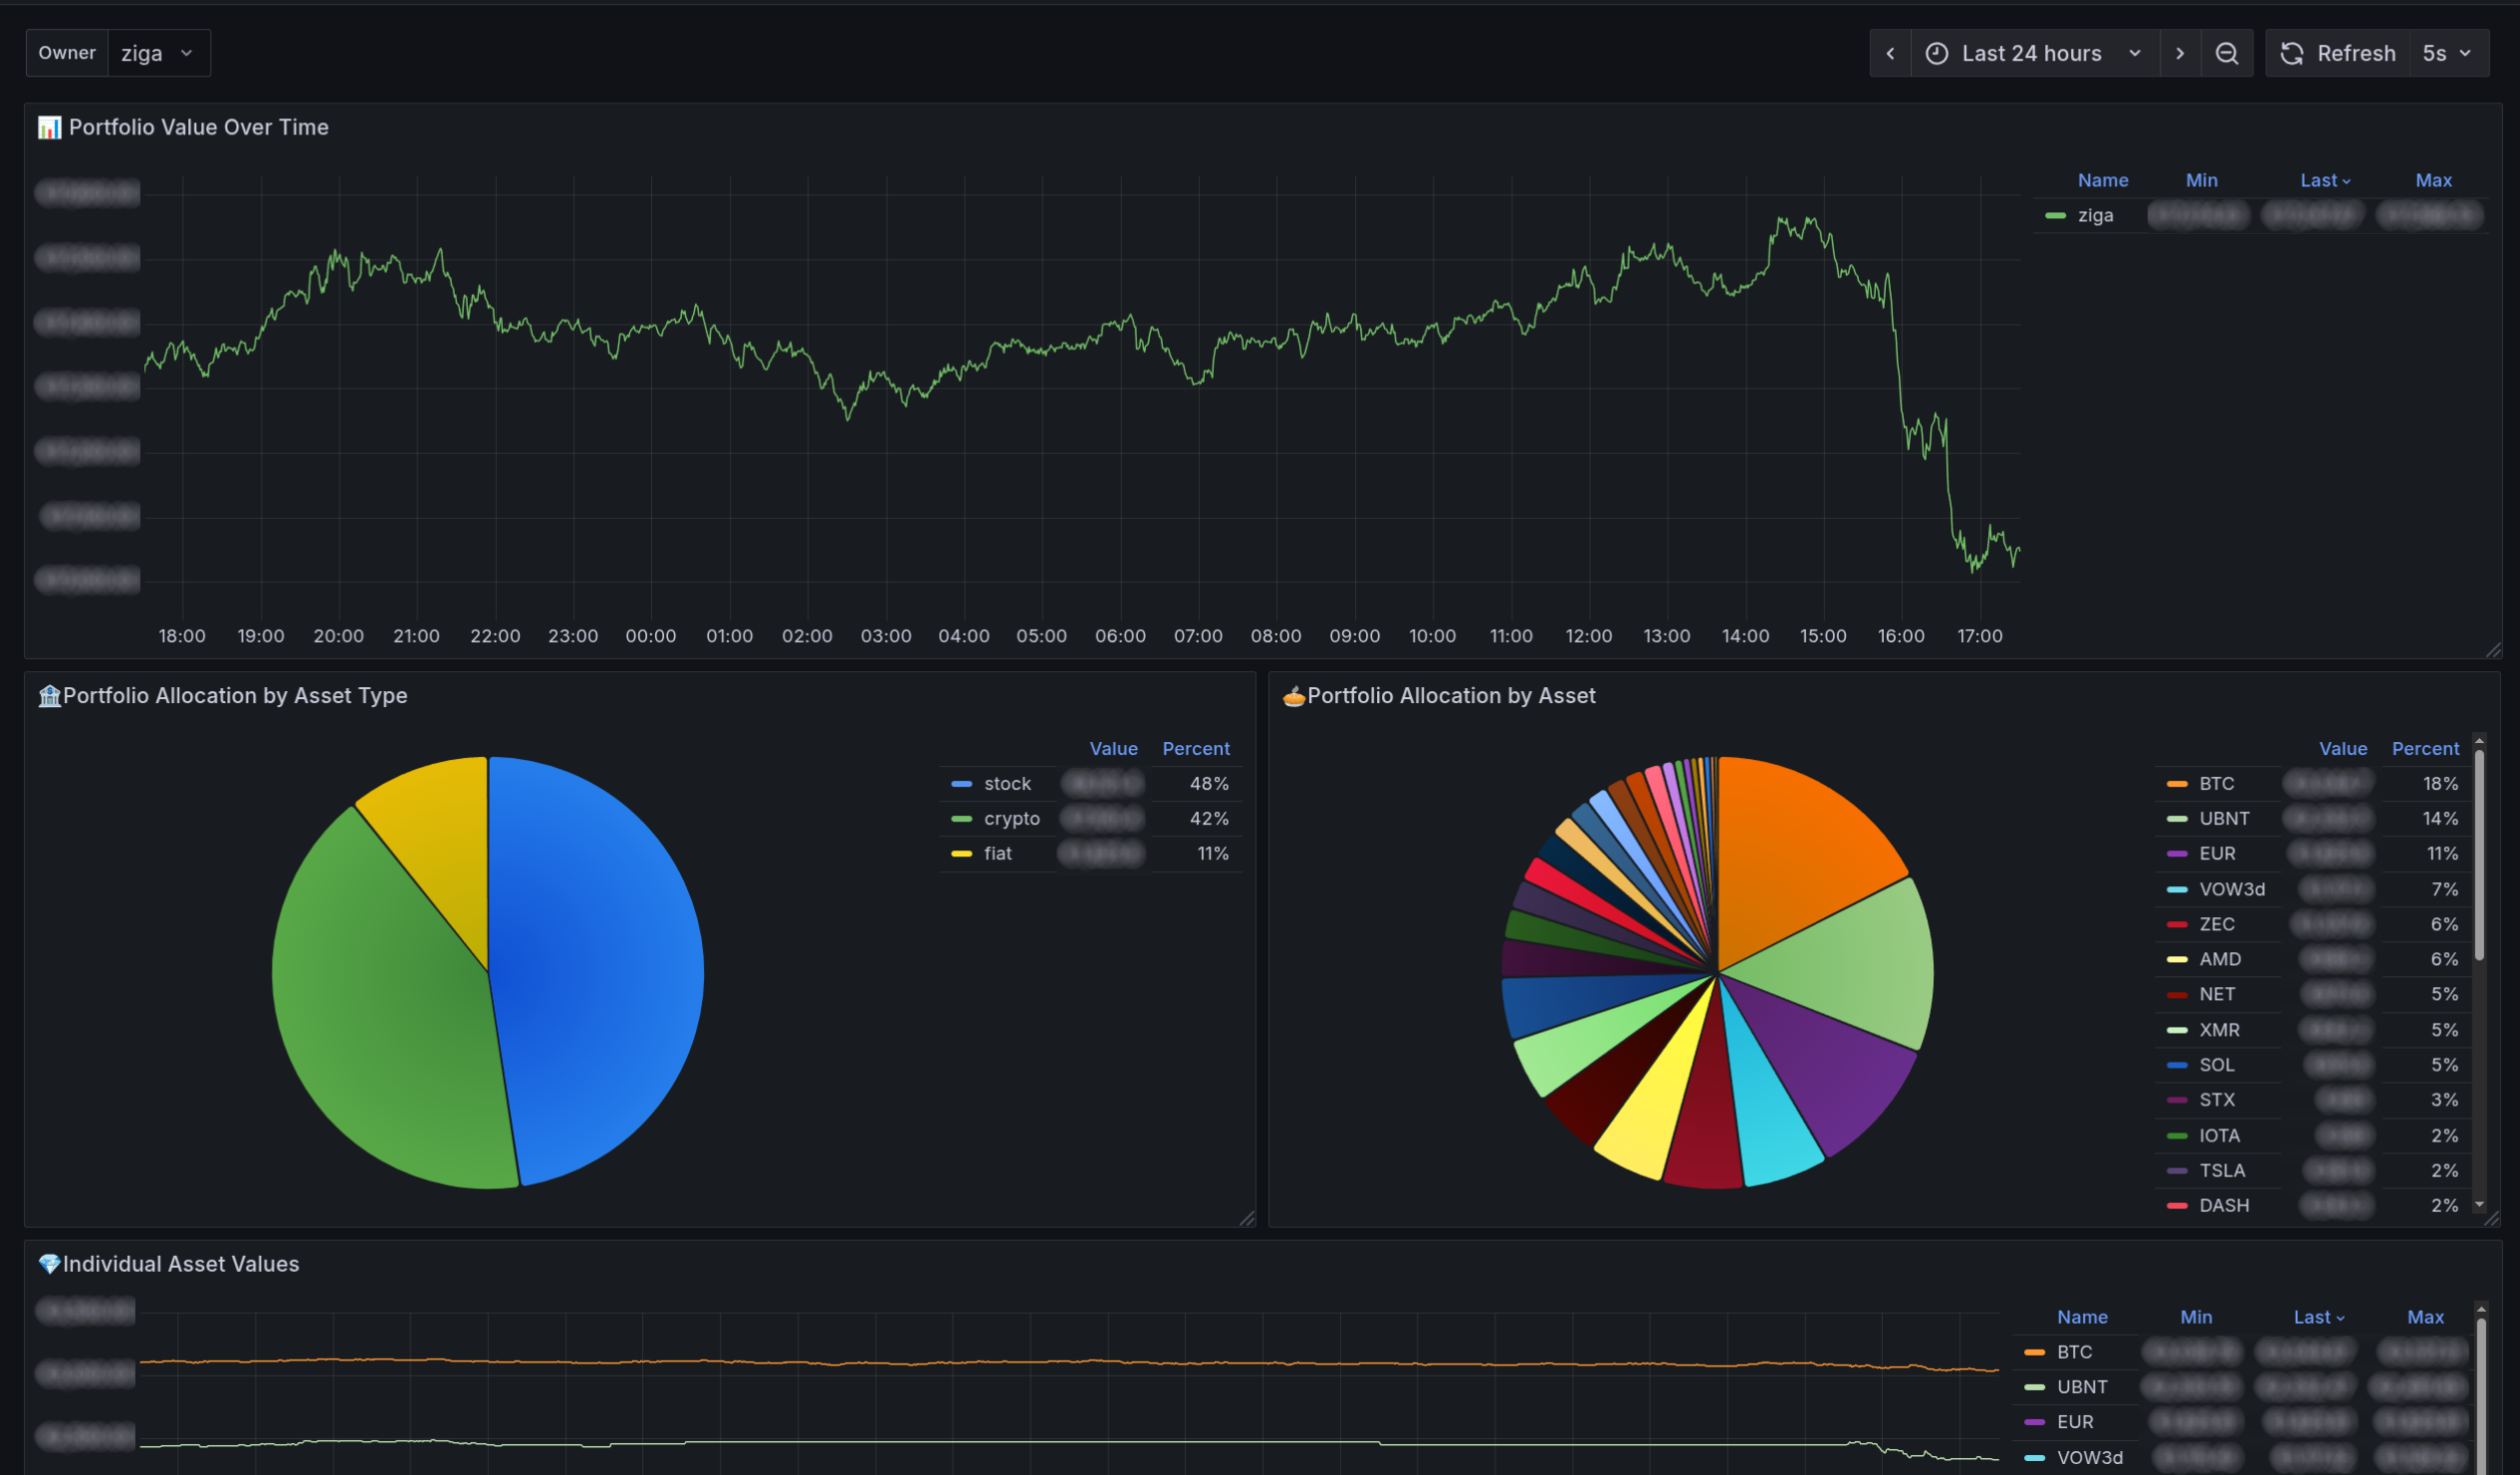
Grafana Dashboard

Pre-made Grafana dashboard can be downloaded from here: https://grafana.com/grafana/dashboards/24333
Data source config
Collector type:
Collector plugins:
Collector config:
Revisions
Upload an updated version of an exported dashboard.json file from Grafana
| Revision | Description | Created | |
|---|---|---|---|
| Download |