
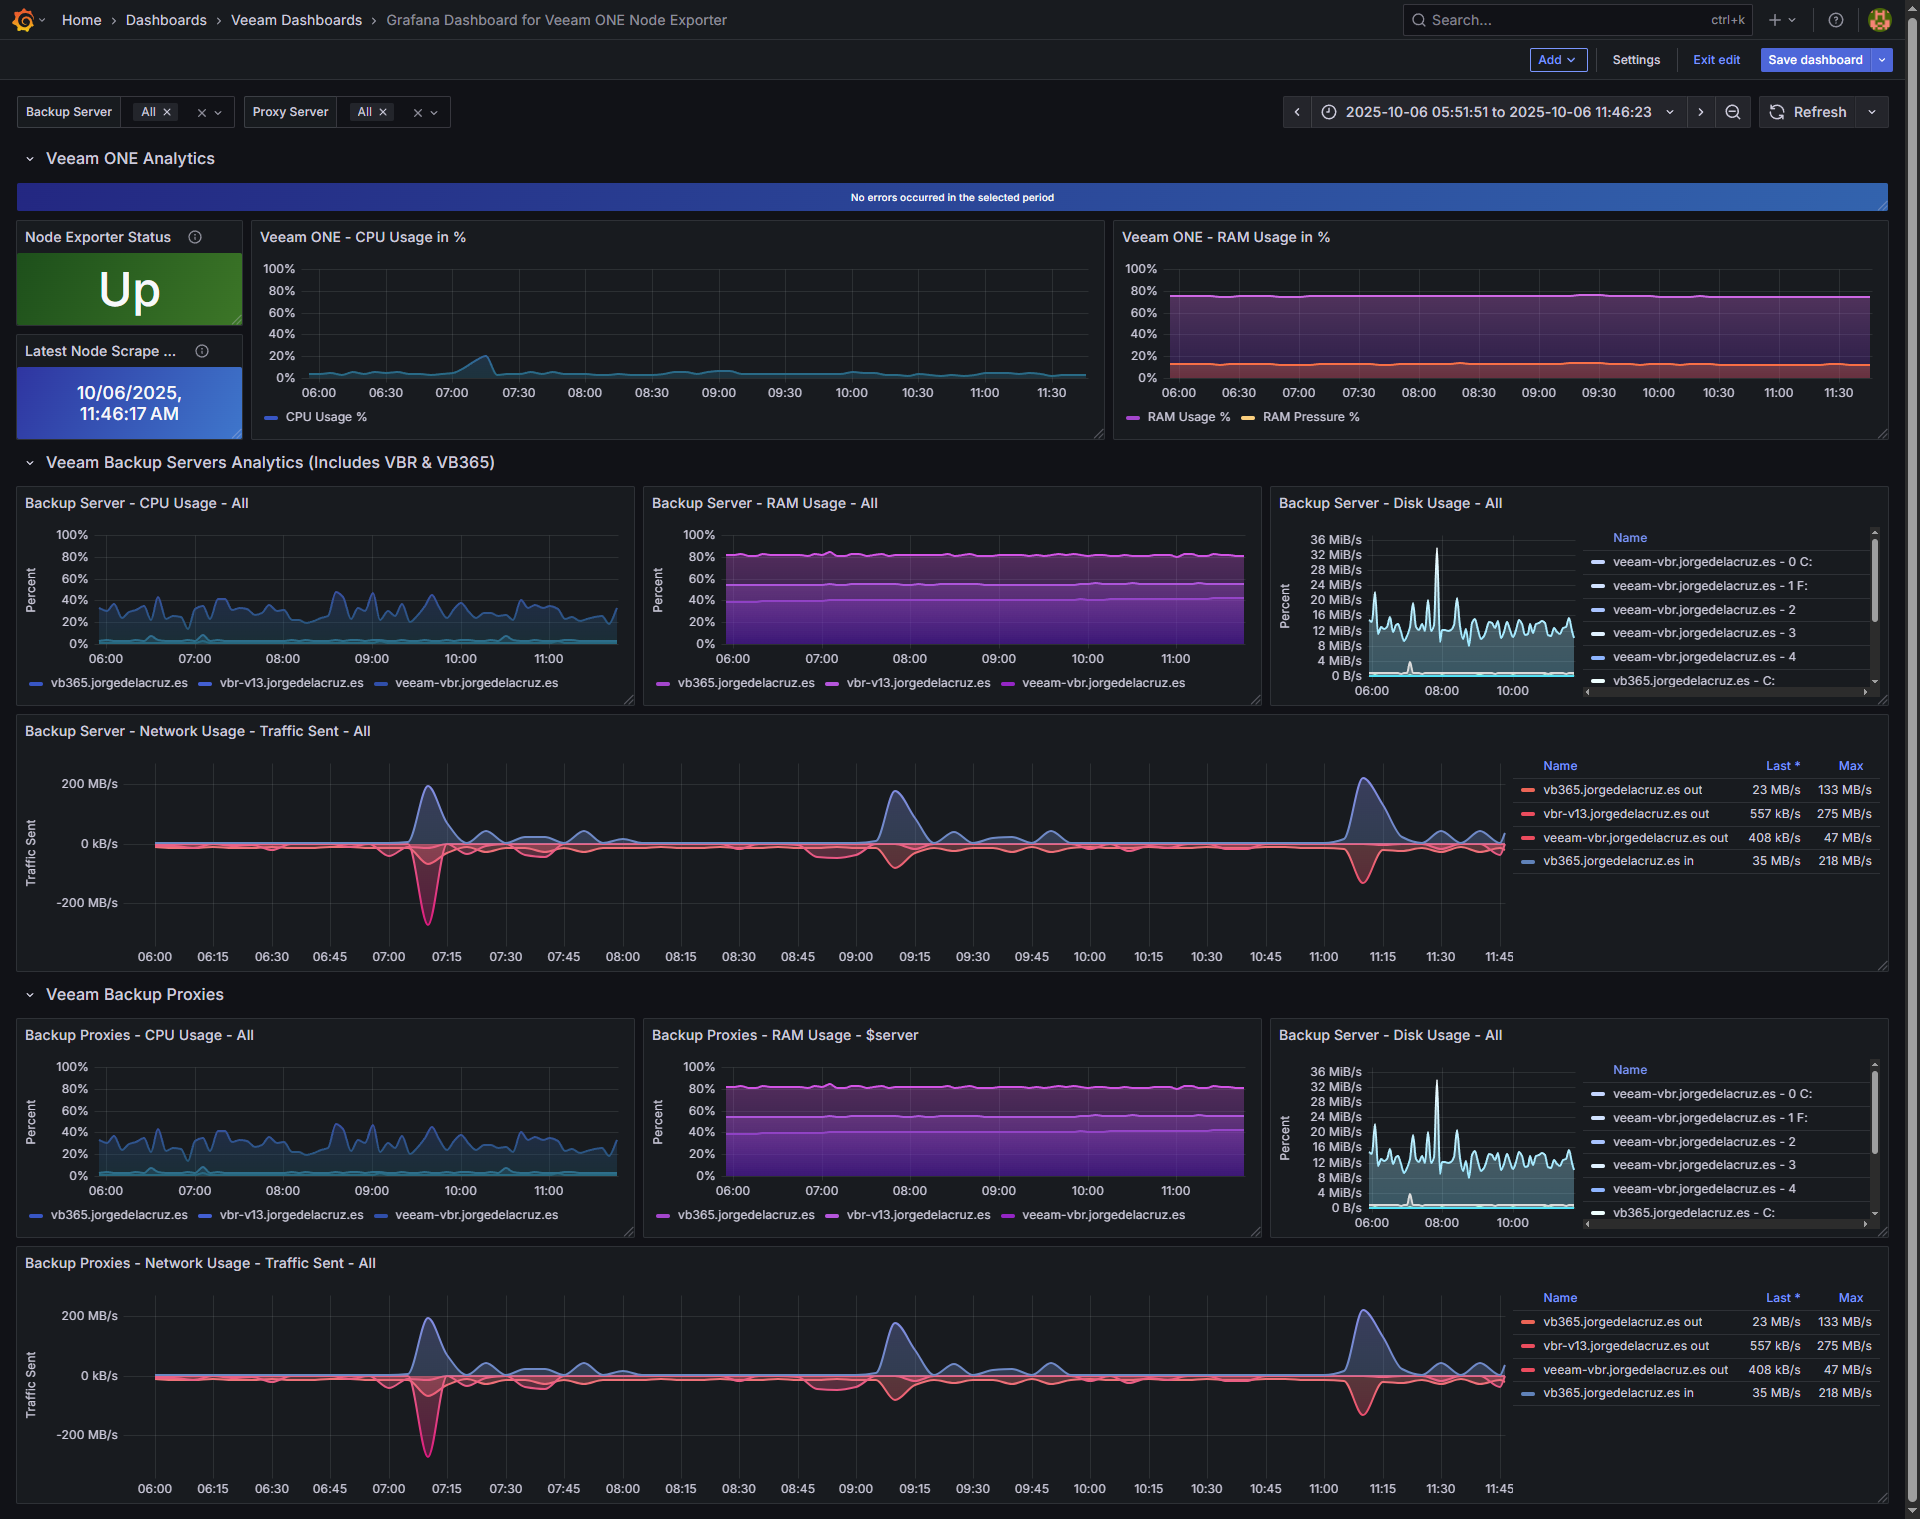
Grafana Dashboard for Veeam ONE Node Exporter
Grafana Dashboard for Veeam ONE Node Exporter (Unofficial)
Just download the latest unofficial Veeam ONE Node Exporter from the next GitHub, review the appsettings.json and run it.
Review that you are publishing data under http://127.0.0.1:9108/metrics
Then with telegraf on the same machine, add this to the configuration:
[[inputs.prometheus]]
  urls = ["http://127.0.0.1:9108/metrics"]
  metric_version = 2
  name_override = "vone_exporter"
Restart the Telegraf service, add this dashboard to Grafana and enjoy.
Data source config
Collector type:
Collector plugins:
Collector config:
Revisions
Upload an updated version of an exported dashboard.json file from Grafana
| Revision | Description | Created | |
|---|---|---|---|
| Download |
Linux Server
Monitor Linux with Grafana. Easily monitor your Linux deployment with Grafana Cloud's out-of-the-box monitoring solution.
Learn more