
Tailscale / Machine
An overview of tailscaled daemon metrics including inbound/outbound traffic by path, dropped packets by reason, health messages, and per-machine drilldown with DERP vs non-DERP traffic breakdown. The dashboards were generated using [tailscale-mixin](https://github.com/adinhodovic/tailscale-exporter/tree/main/tailscale-mixin). Open issues and create feature requests in the repository.
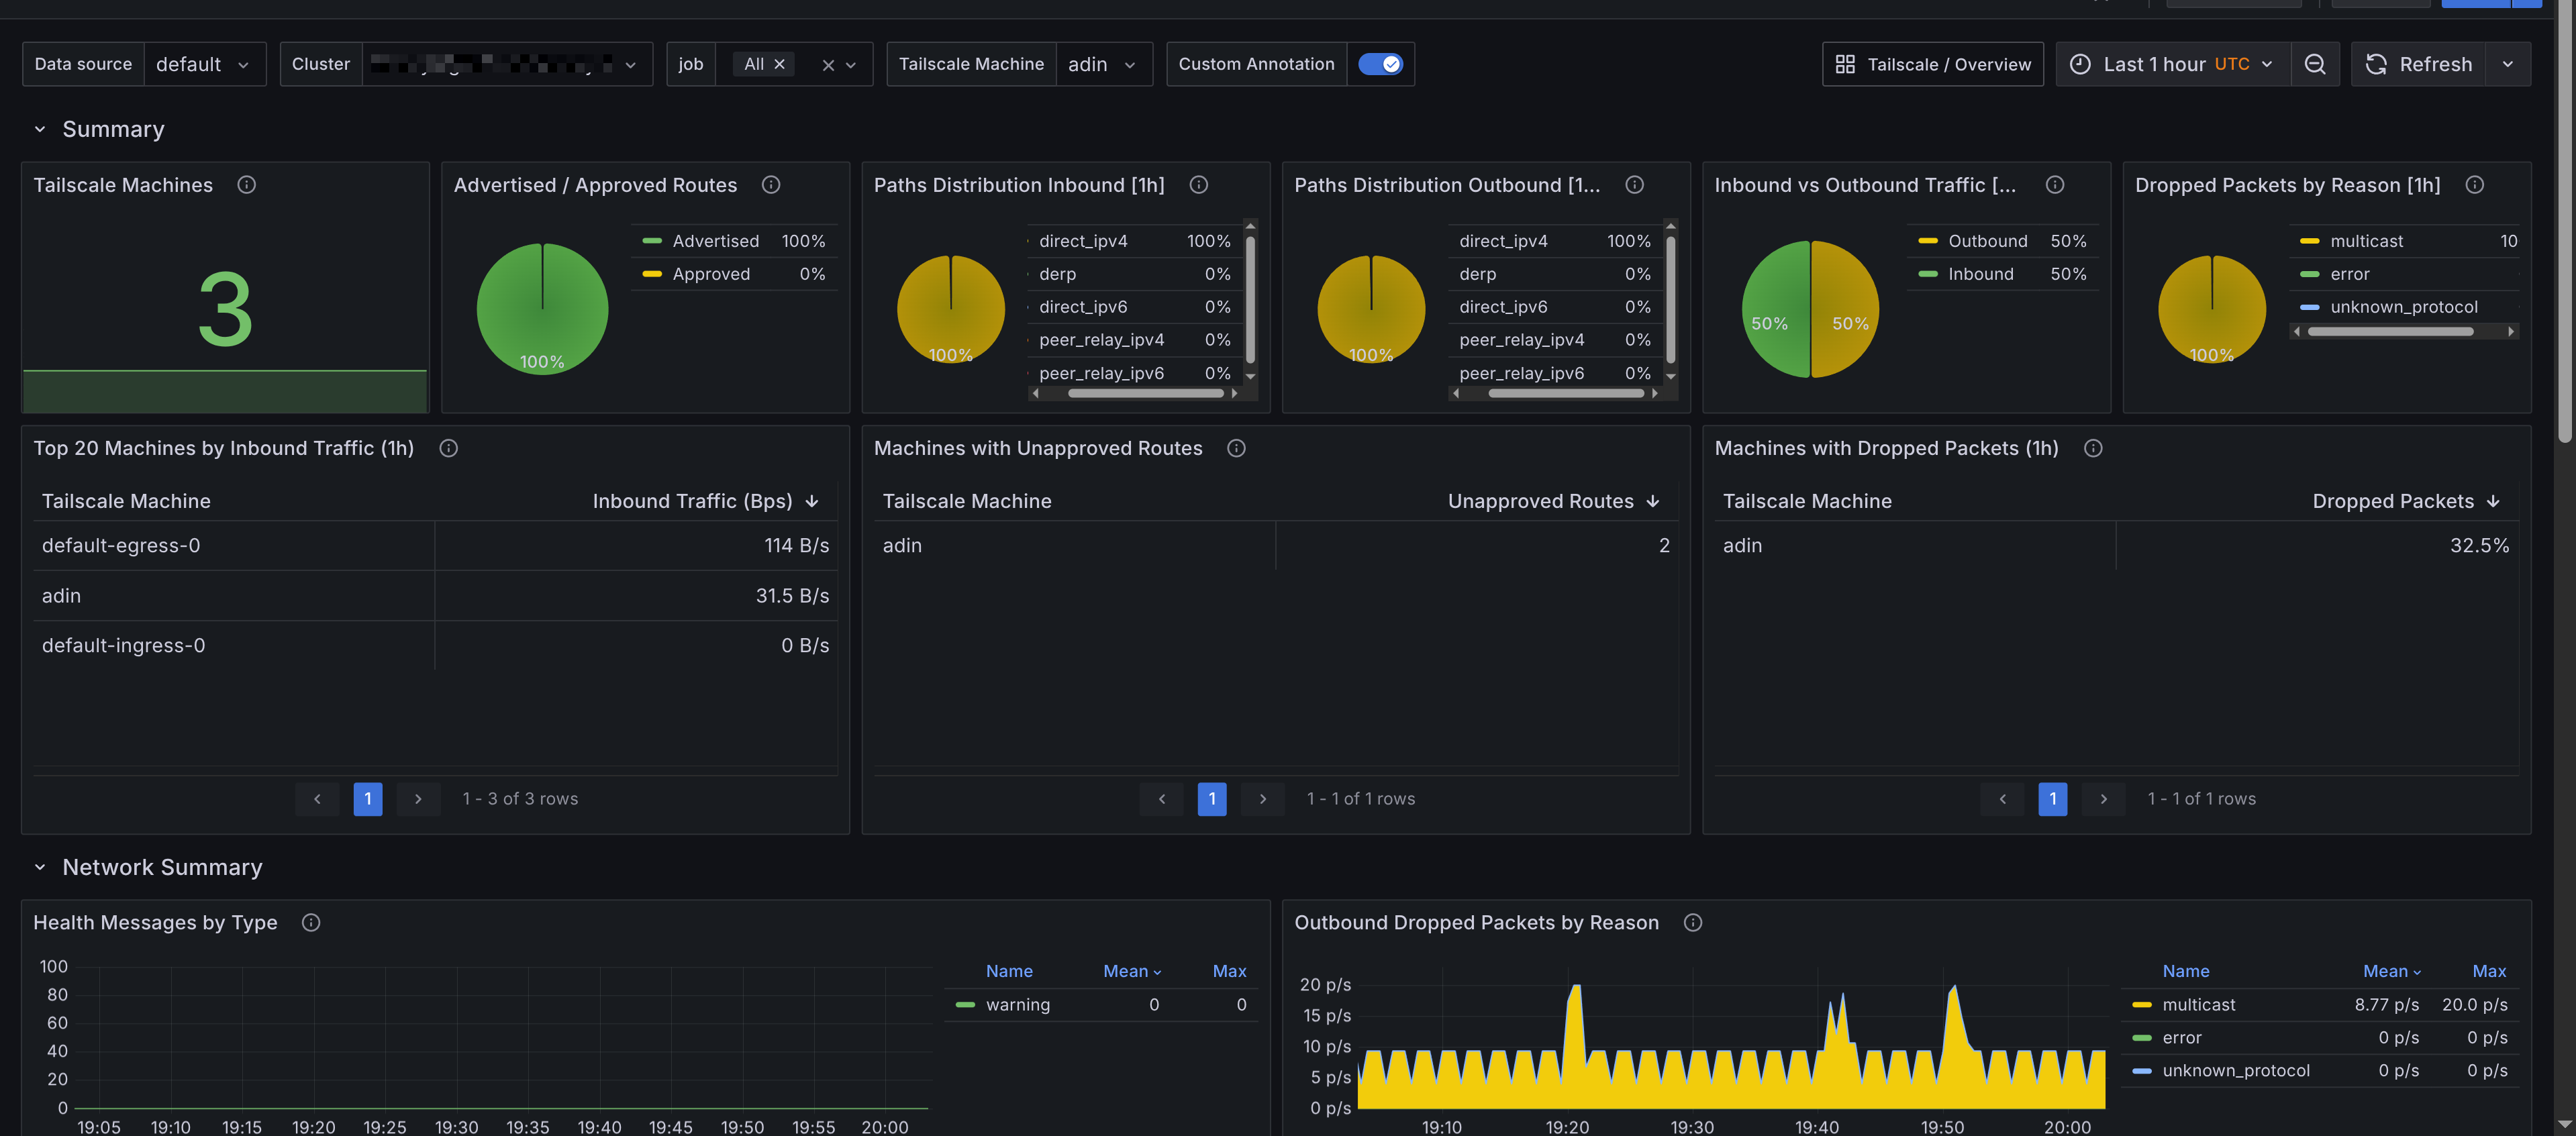
A dashboard that gives an overview of Tailscale Machine daemon metrics. The dashboards were generated using tailscale-mixin. Open issues and create feature requests in the repository.
These depend on adding a custom tailscale_machine label to your relabeling configs.
Data source config
Collector config:
Upload an updated version of an exported dashboard.json file from Grafana
| Revision | Description | Created | |
|---|---|---|---|
| Download |
Java Virtual Machine (JVM)
Easily monitor a Java virtual machine, which allows computers to run Java programs, with Grafana Cloud's out-of-the-box monitoring solution.
Learn more