
Agent Framework Workflow
Comprehensive monitoring dashboard for Agent Framework workflows, tracking execution metrics, performance analysis, and trace visualization
Agent Framework - Workflow Overview

Comprehensive monitoring dashboard for Microsoft Agent Framework Workflows, tracking workflow executions, executor performance, visual workflow graphs, and detailed trace analysis. Monitor your multi-agent workflows' health, execution paths, success rates, and identify bottlenecks in real-time.
🔄 What are Agent Framework Workflows?
Microsoft Agent Framework Workflows provide a structured way to orchestrate complex, multi-step processes involving multiple AI agents, functions, and external systems. Unlike single AI agents that work autonomously, workflows give you explicit control over execution paths through a graph-based architecture.
Workflows are designed to handle tasks that are too complex for a single agent, offering:
- Modularity: Break down processes into reusable components
- Agent Integration: Orchestrate multiple AI agents with non-agentic functions
- Type Safety: Strong typing ensures correct message flow between components
- Flexible Flow: Graph-based executors with conditional routing and parallel processing
- Checkpointing: Save and resume long-running processes
- Human-in-the-Loop: Built-in request/response patterns for external integration
🎯 Why This Dashboard?
When building multi-agent workflows that coordinate multiple AI agents and functions, you need visibility into:
- Execution Health: Are your workflows completing successfully?
- Performance: Where are the bottlenecks in your execution graph?
- Executor Behavior: Which executors are taking the longest? Which ones fail most often?
- Workflow Structure: How are your executors connected? What's the execution flow?
- Debugging: What happened in failed workflow runs?
This dashboard answers all these questions and more—with interactive visualizations and real-time metrics.
✨ Dashboard Highlights
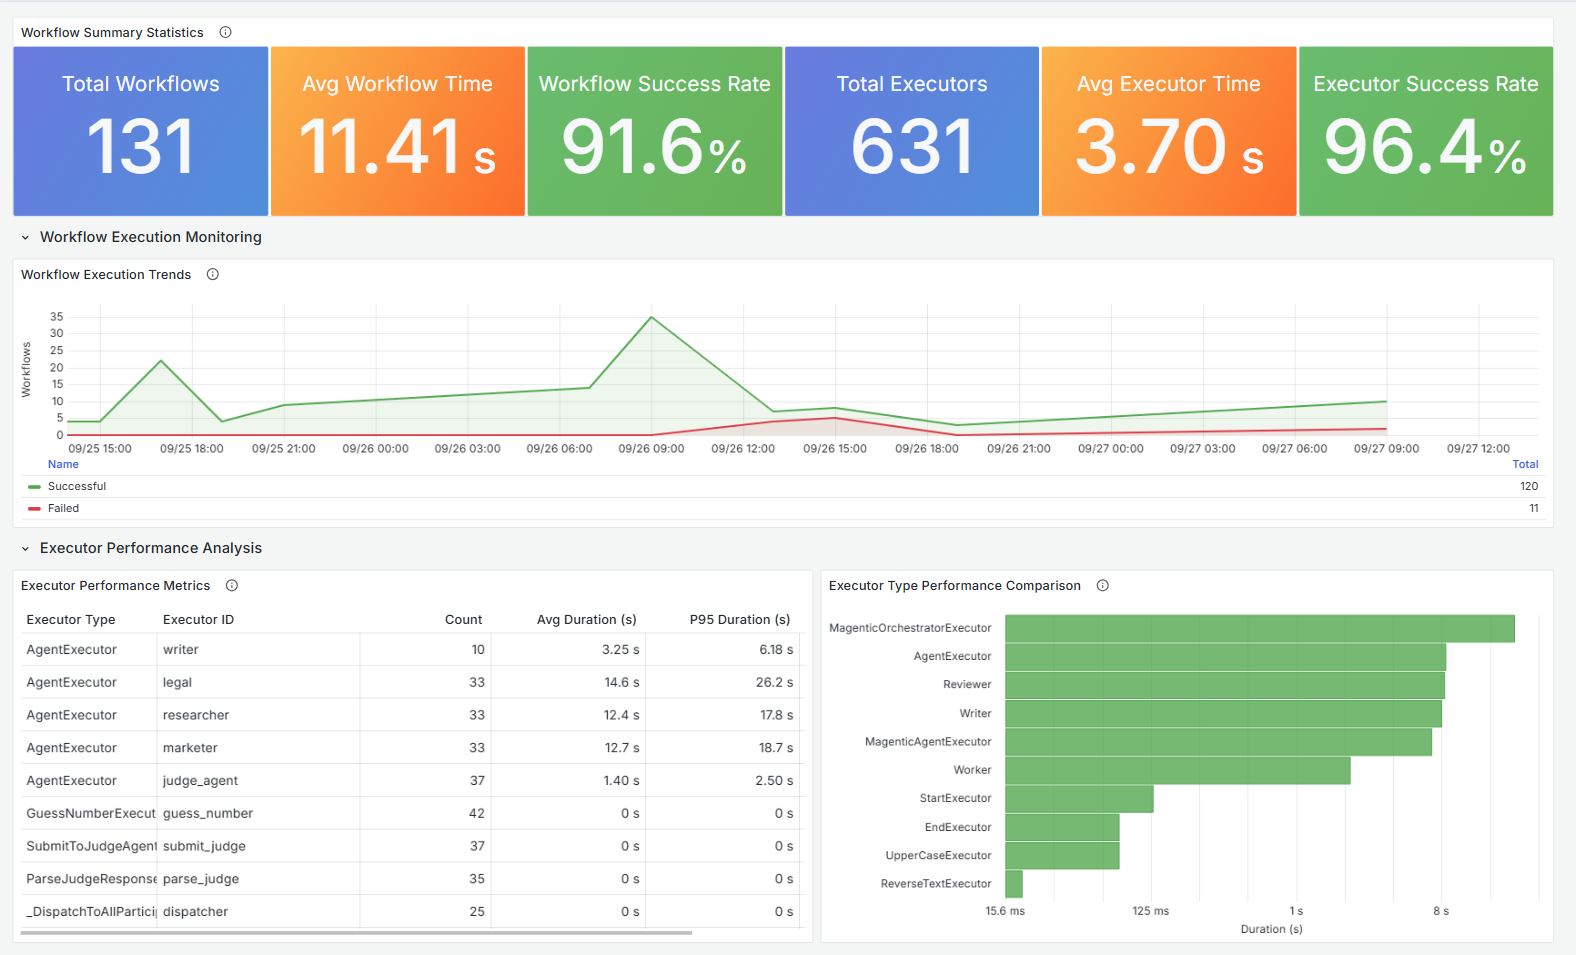
📊 Workflow Summary Statistics
- Overall Metrics: Total workflows, executors, average execution times
- Success Rate Monitoring: Track completion rates for workflows and executors
- Quick Health Check: Instant overview of your workflow system performance
- Dual-Level Insights: Separate metrics for workflow-level and executor-level operations
📈 Workflow Execution Monitoring
- Execution Trends: Visualize successful vs. failed workflow runs over time
- Time Series Analysis: Identify patterns, peak loads, and anomalies
- Success/Failure Breakdown: Color-coded visualization for quick health assessment
- Historical Tracking: Monitor how your workflows perform across different time periods
⚡ Executor Performance Analysis
- Performance Metrics Table: Comprehensive breakdown by executor type and ID
- Duration Analysis: Average and 95th percentile execution times
- Success Rate Tracking: Monitor reliability of individual executors
- Execution Count: Identify most-used and potentially problematic executors
- Performance Comparison: Visual bar chart comparing executor types side-by-side
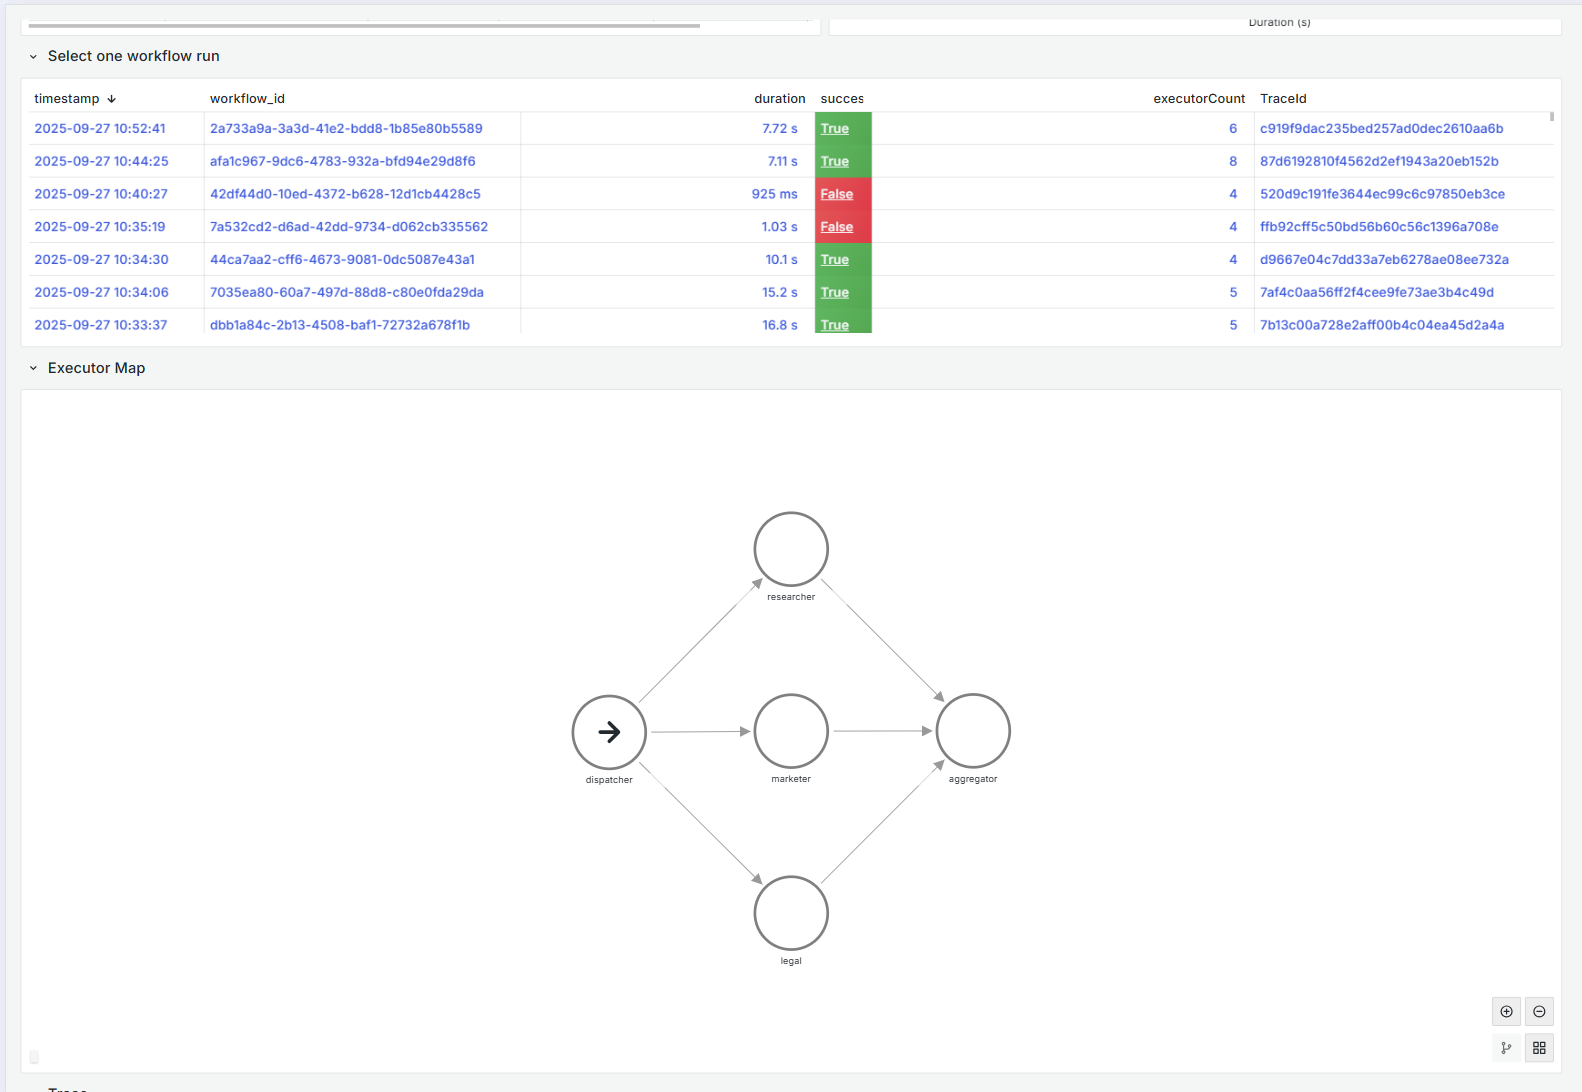
🗺️ Interactive Workflow Selection
- Workflow Run Table: Browse recent executions with trace IDs
- Quick Navigation: Click any workflow to dive into detailed analysis
- Execution Details: View duration, success status, executor count, and timestamps
- Trace Integration: Seamless navigation to distributed tracing views
🔍 Visual Workflow Graph
- Executor Map: Interactive node graph showing workflow structure
- Dependency Visualization: See how executors connect and flow
- Start Point Highlighting: Clearly identifies workflow entry points
- Graph Exploration: Zoom and navigate through complex workflow architectures
- Real-Time Structure: Understand the execution path your workflows follow
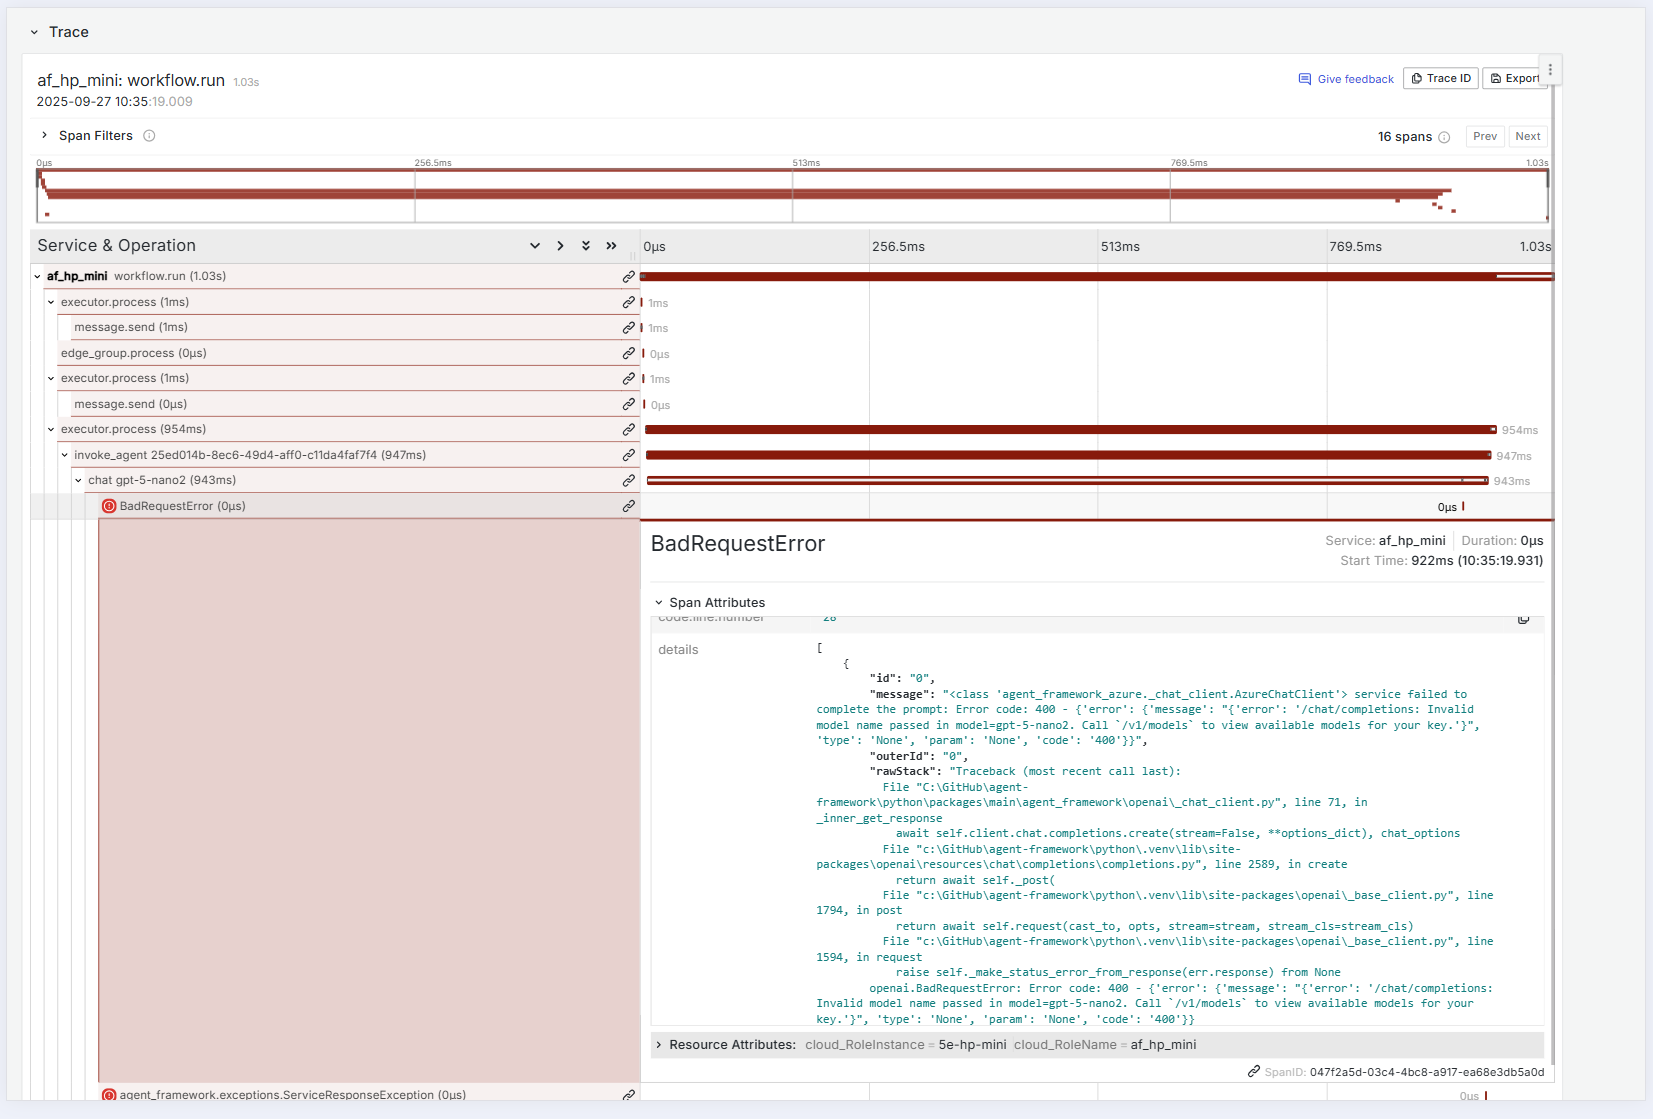
🔬 Detailed Trace Analysis
- Distributed Tracing: Complete execution timeline for selected workflows
- Dependency Tracking: Visualize all executor calls and their relationships
- Performance Deep-Dive: Identify slow executors and bottlenecks
- Error Investigation: Drill down into failed executions to find root causes
- Execution Timeline: See the full span of your workflow execution with timing data
💡 Pro Tips
- Optimize Slow Executors: Use the executor performance table to identify bottlenecks
- Pattern Recognition: Monitor execution trends to identify peak usage times
- Debug Failures: Click on failed workflows to see their complete trace
- Graph Analysis: Study the executor map to understand complex workflow structures
- Success Rate Alerts: Set up alerts based on workflow success rate thresholds
🤝 Contributing
Found a bug or have a feature request?
- Open an issue
- Submit a pull request
- Share your workflow monitoring insights!
📚 Resources
- Microsoft Agent Framework Documentation
- Agent Framework Workflows Guide
- Agent Framework GitHub Repository
- Azure Application Insights
- Grafana Documentation
Ready to visualize your multi-agent workflows? Import this dashboard and gain complete visibility into your Agent Framework workflow orchestrations! 🚀
Data source config
Collector config:
Upload an updated version of an exported dashboard.json file from Grafana
| Revision | Description | Created | |
|---|---|---|---|
| Download |
Grafana Agent
Easily monitor metrics and logs from a Grafana Agent instance with Grafana Cloud's out-of-the-box monitoring solution.
Learn more